Using PIP to Detect Localised Variations in Mechanical Properties in an Aluminium Forging


Challenge
Where machining tensile specimens for testing is not an option, hardness is often considered as a solution.
This poses a significant limitation; while hardness testing offers advantages such as affordability, speed, ease of use, and suitability for testing small specimens, a hardness number is not a fundamental material property. Furthermore, practitioners are limited to conversions into a limited set of material property values, as hardness numbers cannot give full stress-strain curves, which means that without further information finite element modelling cannot always be conducted accurately.
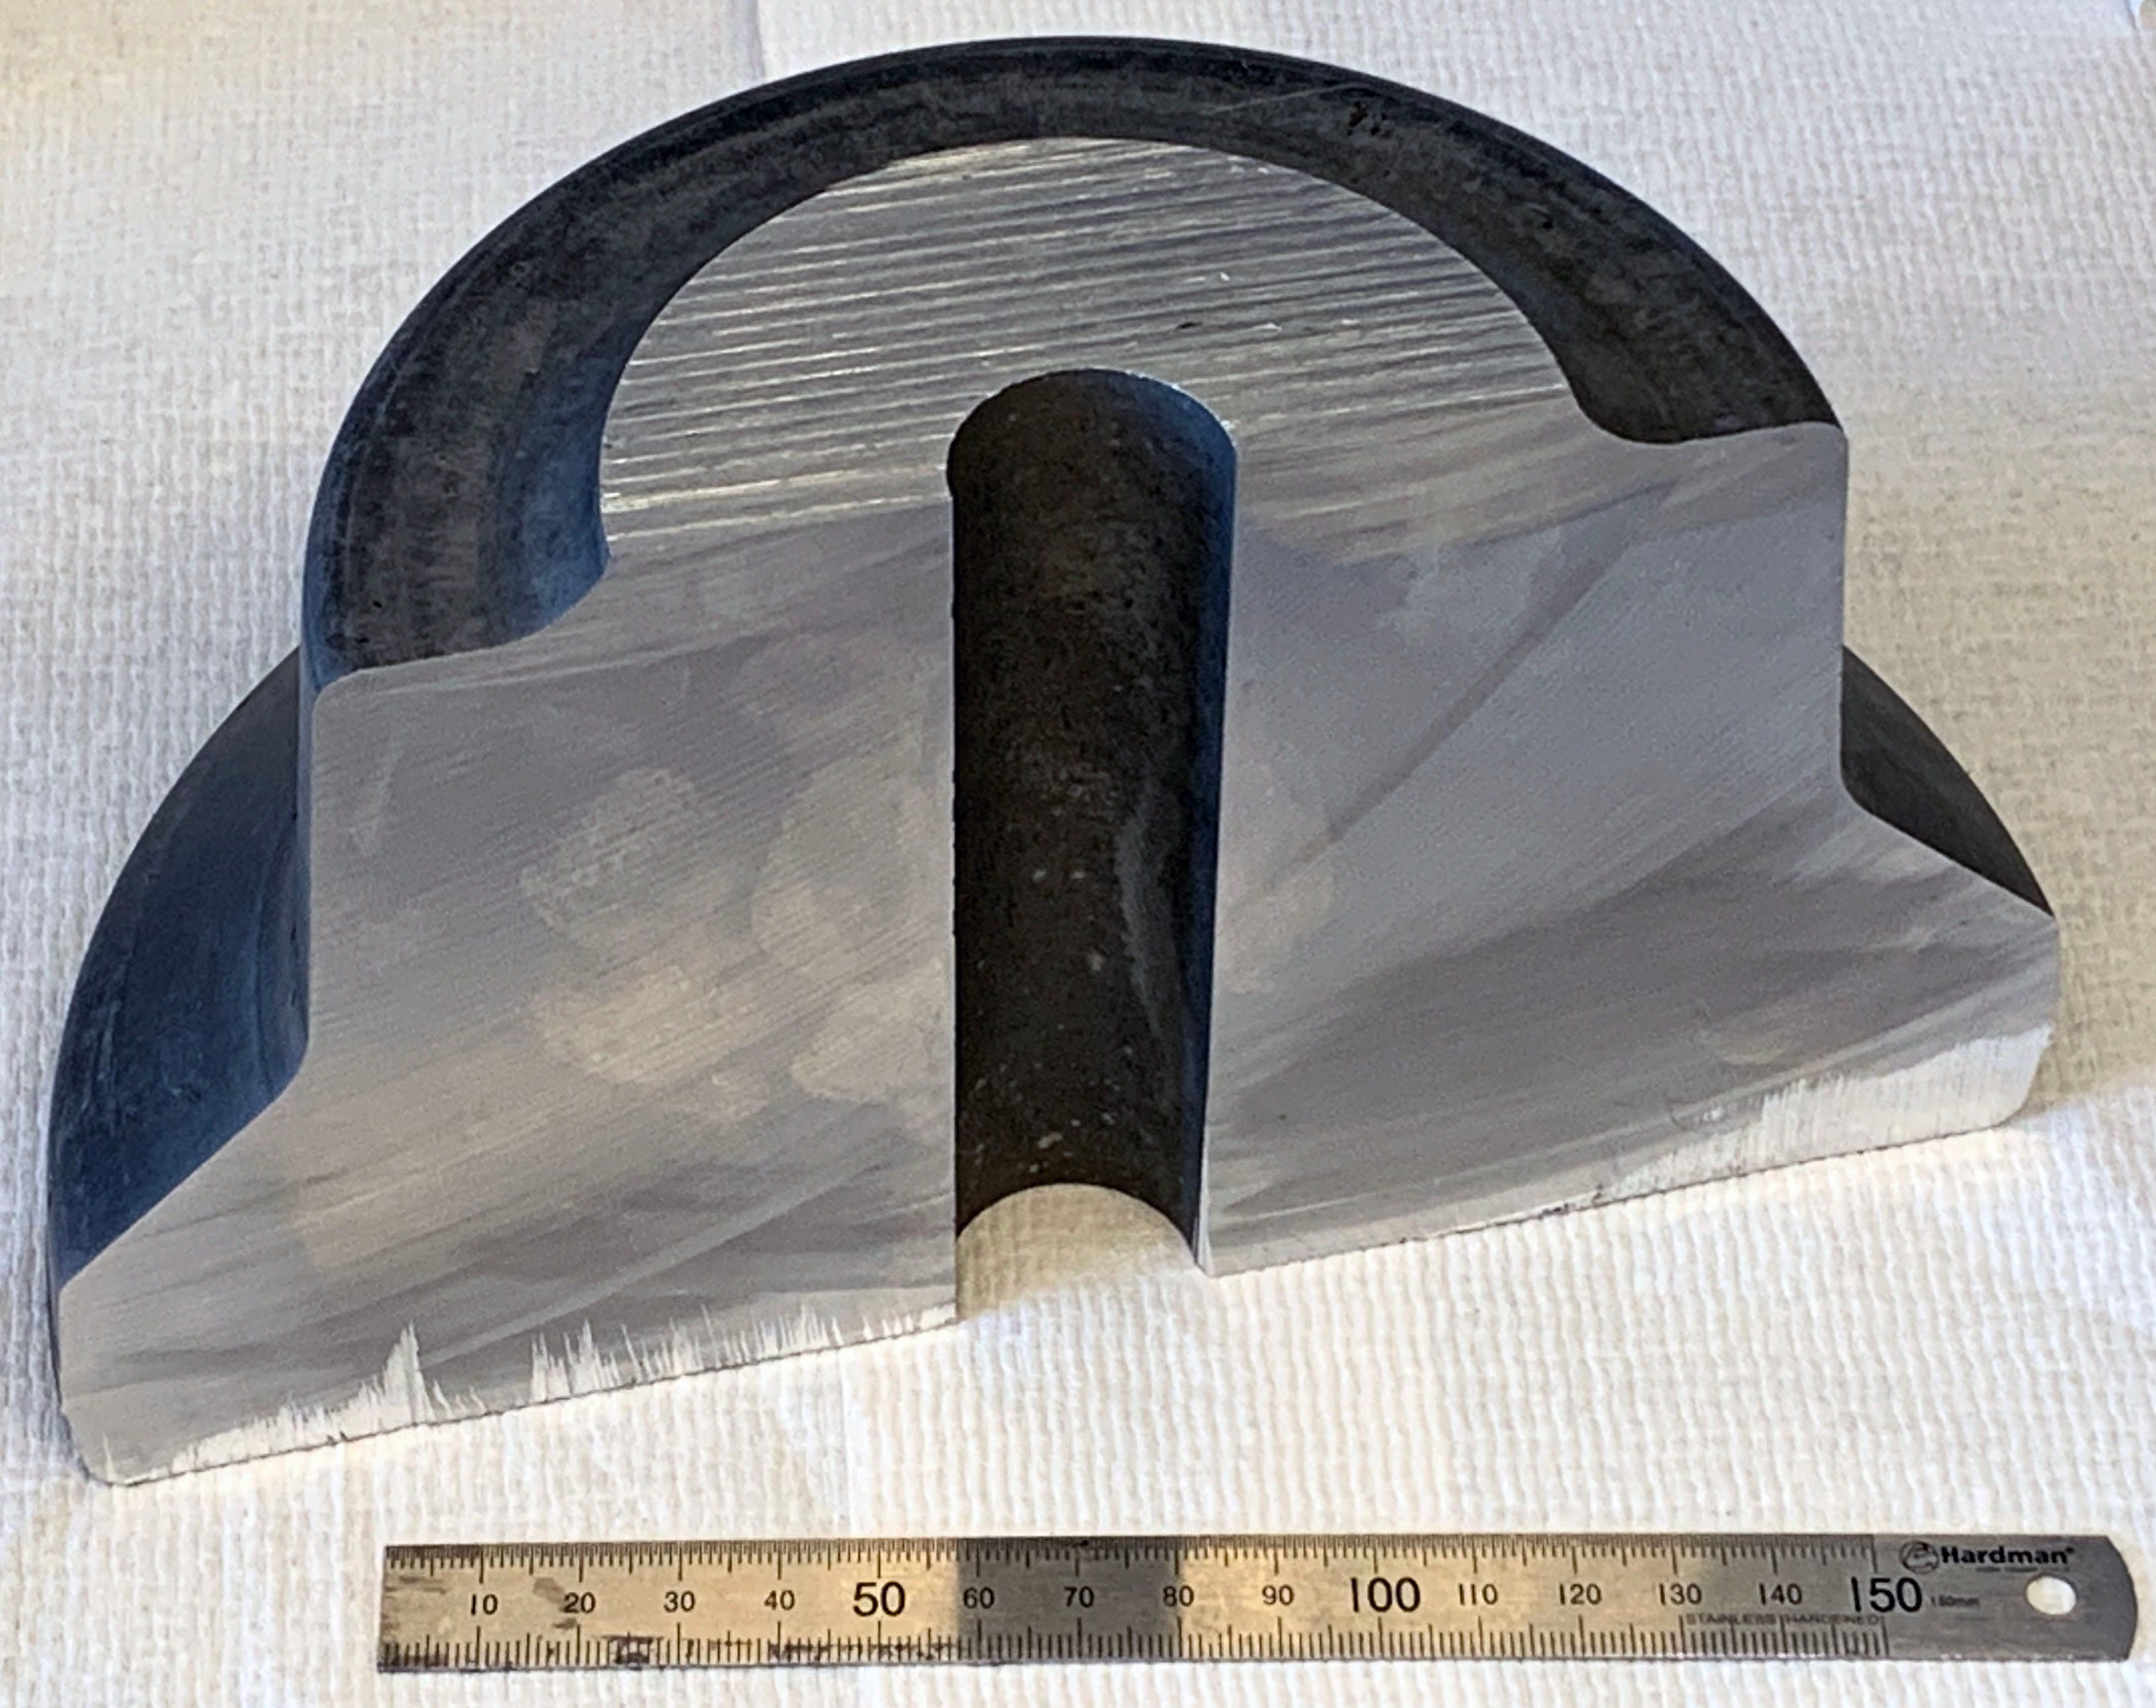
It is common, especially in forged parts, for components to exhibit large variations in properties. This is notably pronounced when large plastic strains are imposed during forming. When the scale of such inhomogeneity is smaller than the scale of a tensile test, such that the variations have little effect, a different method is needed to detect these differences. Often hardness testing would be used instead, but this doesn’t provide detailed plasticity information.
A test that is able to bridge this gap, giving a full stress-strain curve from an indentation-based test, would be ideally suited to investigating such changes.
Objectives
The objective of this case study was to detect localised variations in the plasticity parameters of an aluminium forging. Additionally, it aims to link these variations to the component microstructure. Traditional uniaxial testing, both tensile and compressive, was carried out and compared to Profilometry-based Indentation Plastometry (PIP testing).
Materials
A section of an aluminium component was investigated, which was produced in a two-stage process. The component was initially cast to a suitable shape and then forged, with the magnitude and directionality of the plastic strain varying between different locations.
The forging contained a significant volume fraction (~7 %) of second phase in the form of relatively coarse (~5-10 µm) precipitates. These were identified by X-ray diffraction as Fe0.7Ni1.3Al9. They showed a strong tendency to align so that their longer axis was in a particular direction, and to collect into parallel sets of “stringers”. Such a structureis indicative of large plastic strains being imposed in the direction concerned, and the alignment is expected to create (in-plane) anisotropy.
The variations in microstructure are apparent in micrographs, with Figure 1 indicating the alignment and Figure 2 showing the geometry of the stringers and precipitates. The alignment of the stringers allows the broad nature of the plastic flow field during forging to be visualised.
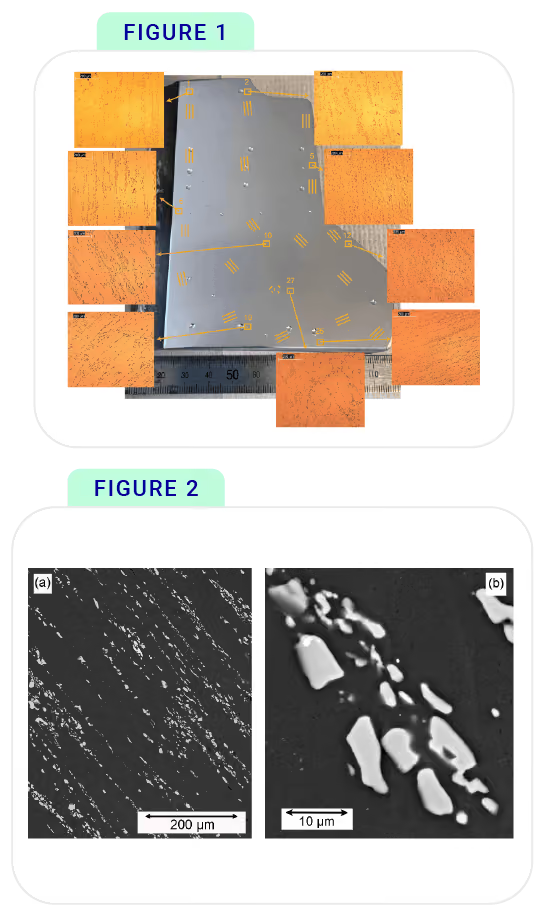
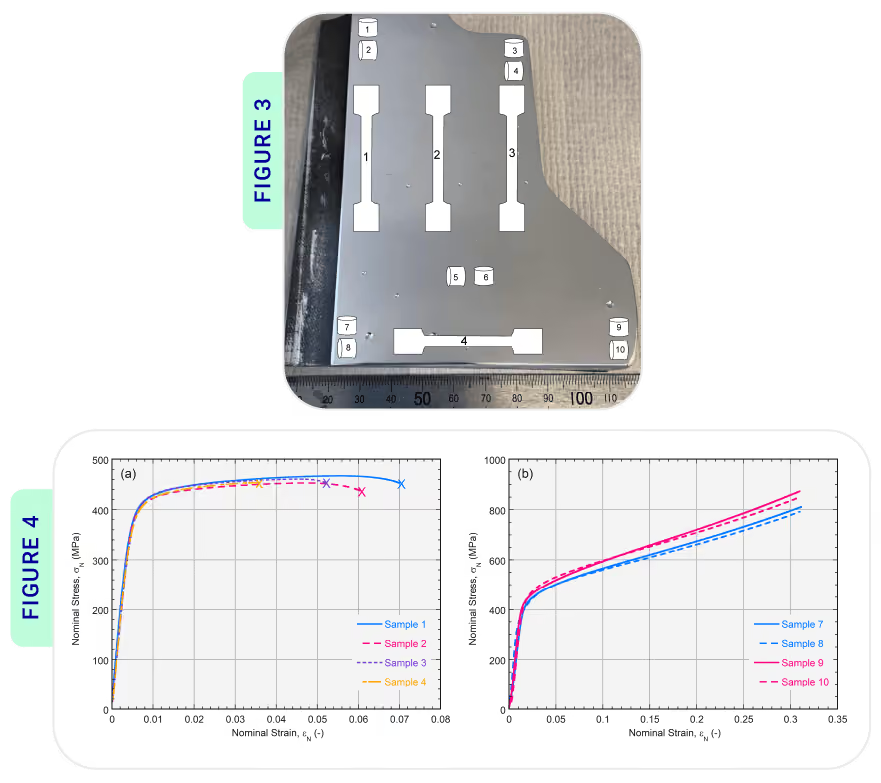
Figure 3: Photo showing locations of 4 tensile and 10 compressive test samples.
Figure 4(a): Tensile stress-strain curves and (b) compressive stress-strain curves, taken from the locations shown in Figure 3.
Uniaxial Testing
Tensile and compressive samples were taken from the locations shown in Figure 3. Details of the test conditions are published elsewhere [1, 2]. Tensile stress-strain curves are shown in Figure 4a, with labels corresponding to the locations shown in Figure 3. These curvesare all very similar, with a yield stress of around 420 MPa and a UTS value ofabout 450 MPa. It’s also evident that there is little systematic difference between the individual curves. This is unsurprising in view of the informationin Figure 3. These tensile tests were interrogating relatively large volumes of material, over which the local variations would probably have had little effect.
Illustrative compressive stress-strain curves are shown in Figure 4b. These relate to two pairs of samples, both from the base region - see Figure 3. Even on the (relatively coarse) scale of compression samples, significant variations are apparent. The yield stress is noticeably higher for samples 9 and 10, which may be associated with that region having experienced higher prior strains during manufacture. This type of relevant information is lost in the tensile test results of Figure 4a.
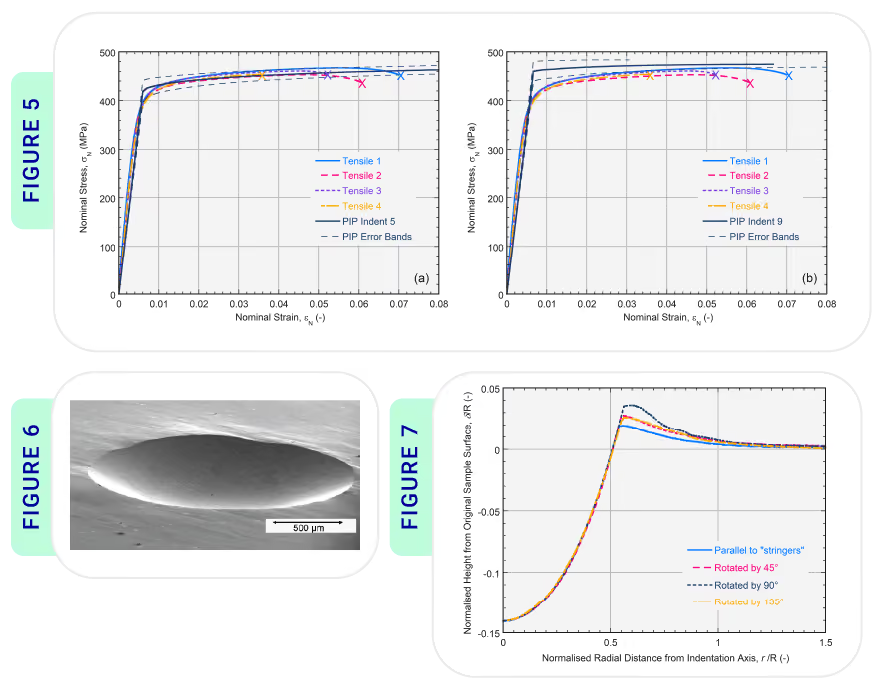
Figure 5: Conventional and PIP-derived tensile stress-strain curves, with the indents located at (a) point 5 and (b) point 9 (as shown in Figure 3).
Figure 6: SEM micrograph of an indent.
Figure 7: Profiles in 4 directions across a single indent, in a region exhibiting pronounced anisotropy, due to the presence of strongly aligned “stringers” of hard particles.
PIP Testing
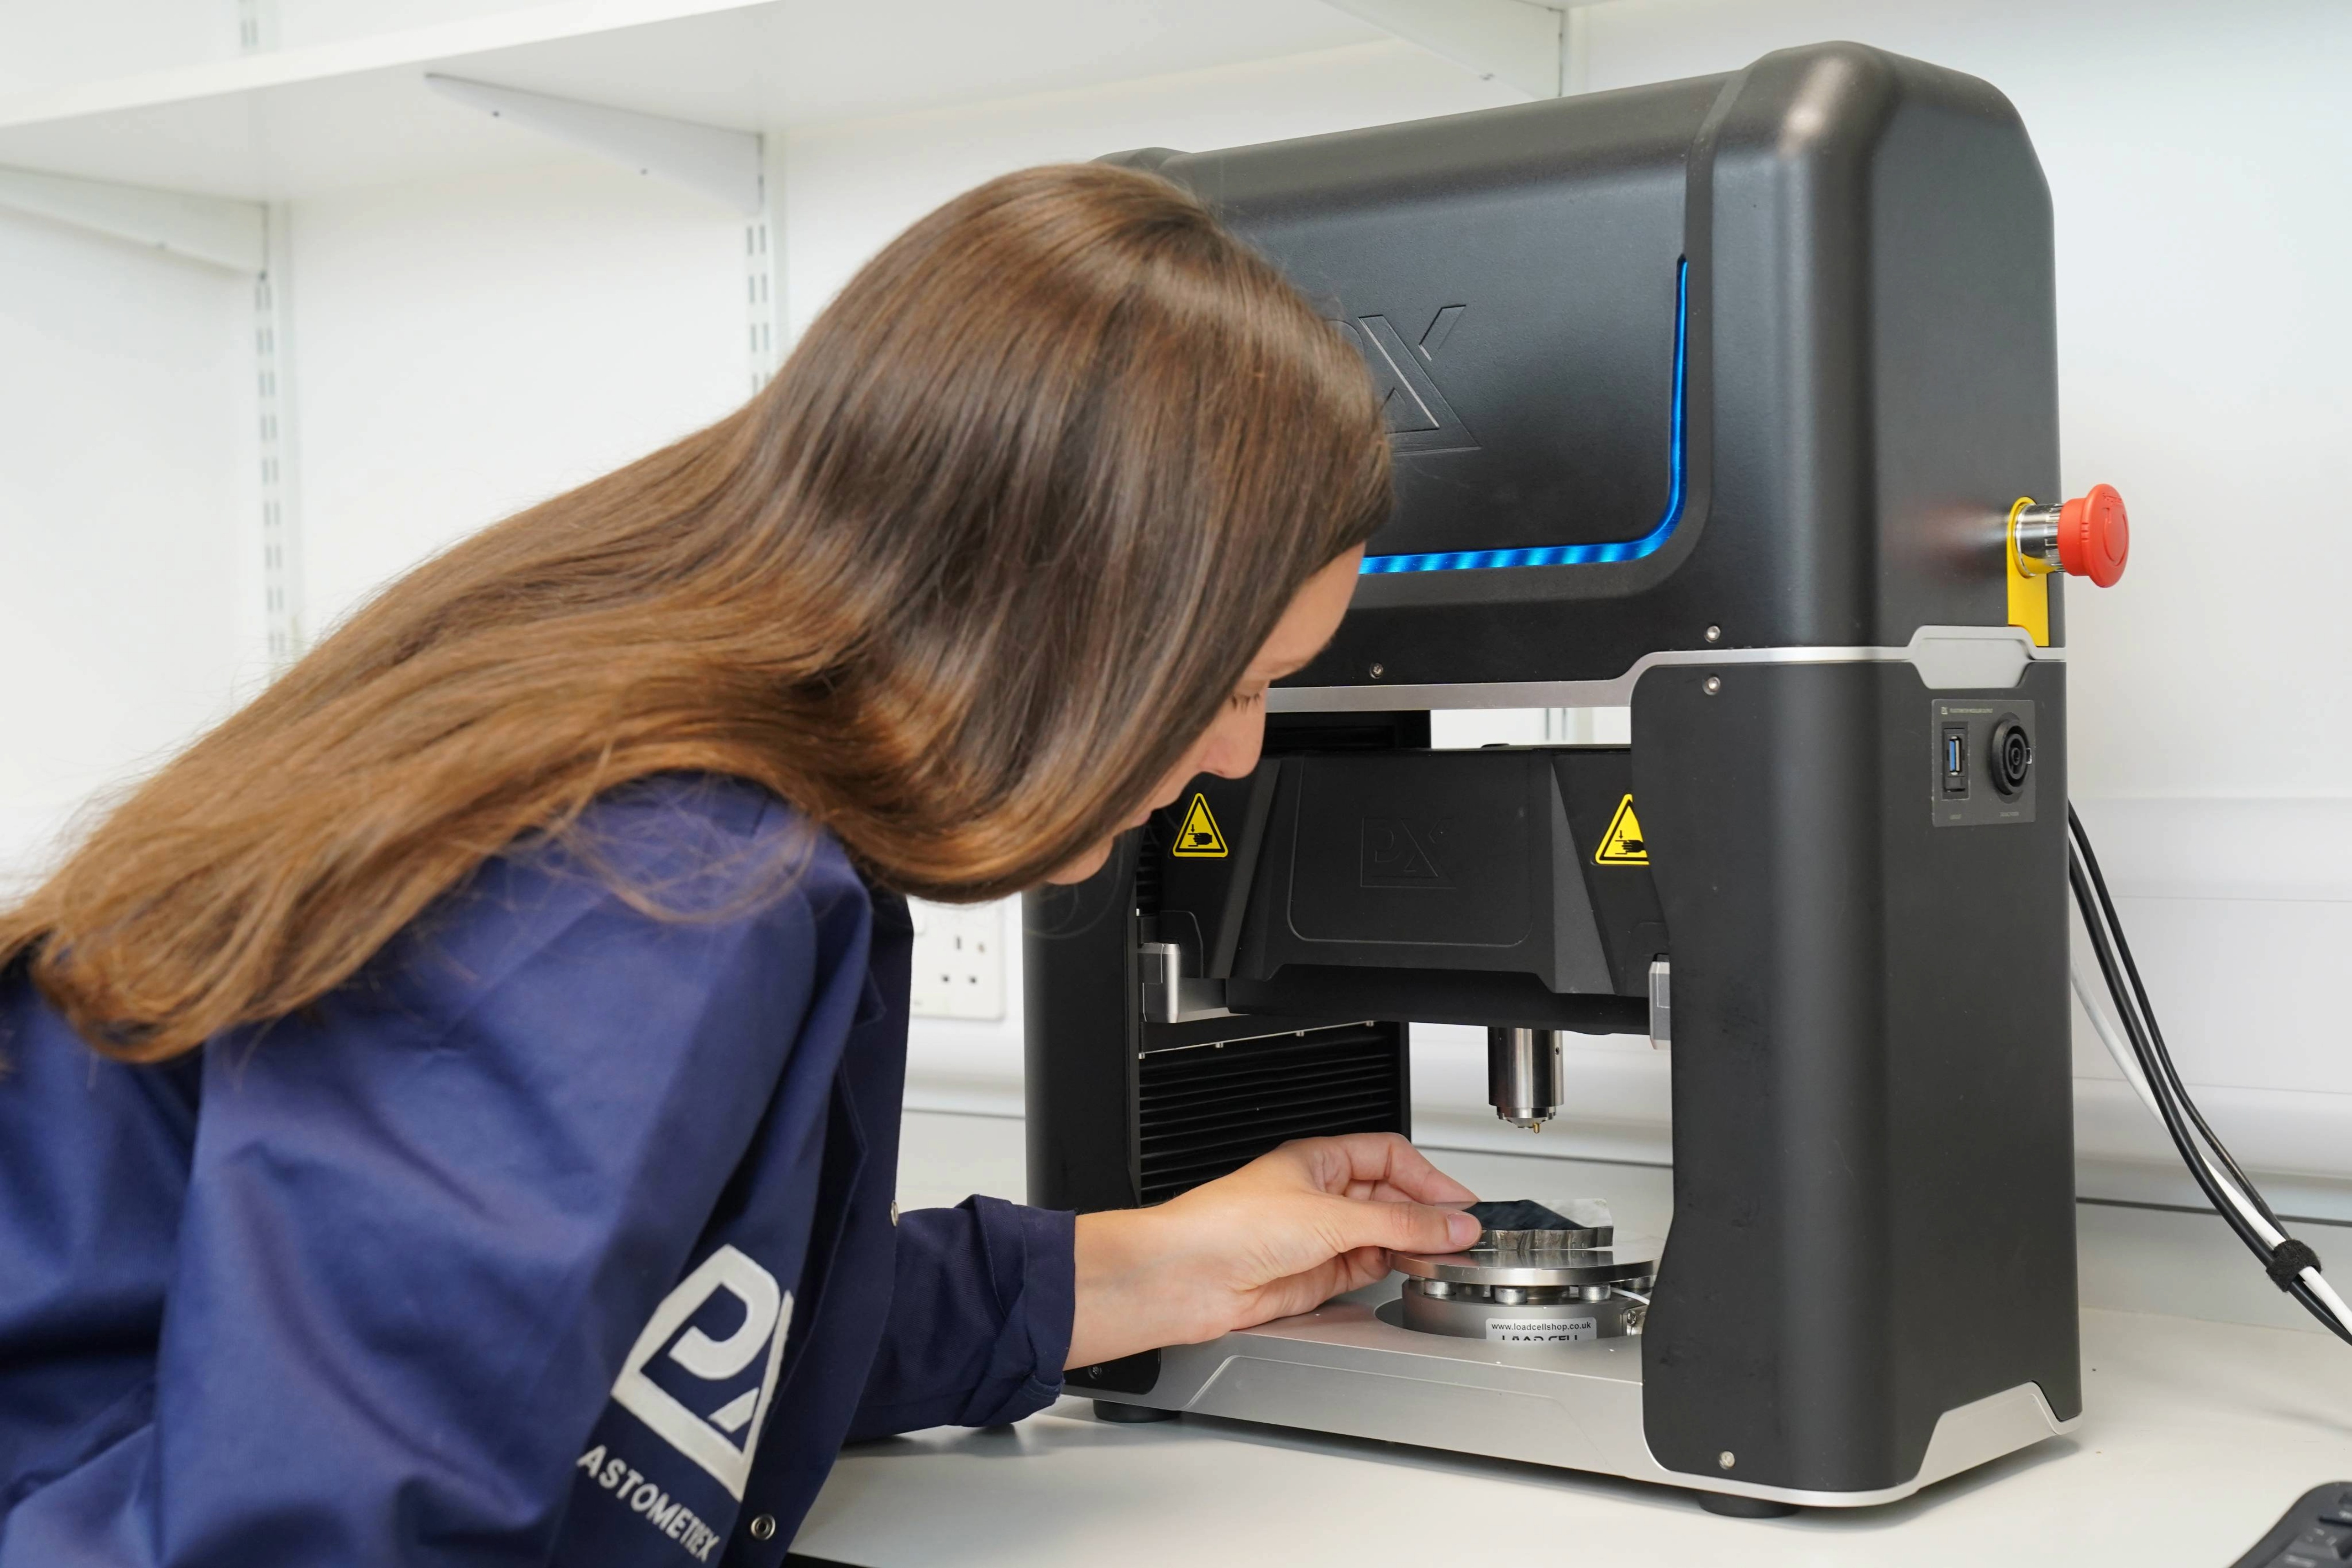
PIP results were measured using a PLX-Benchtop, a compact indentation-based mechanical testing device. PIP uses an accelerated inverse finite element model to infer accurate stress-strain curves from indentation data. Each PIP test simply requires a sample with two flat, parallel sides and a grind to P1200, such that no machining of the section was needed. The test uses a 1 mm radius sphere and takes under 5 minutes, with results available immediately.
PIP tests were carried out in different locations, with significant differences between some of the outcomes. Variations were observed from point to point, consistent with observed differences in local microstructure. As an example, derived plots are shown in Figure 5 for two locations, compared in each case with the tensile curves of Figure 4a. While there are locations for which the indent profiles reflect the tensile test outcomes, and these were in the majority, in other locations the outcome indicated a slightly different response (with a higher yield stress).This outcome highlights the capability of PIP to obtain stress-strain characteristics on a much finer scale than is possible by conventional tensile (or compressive) testing.
PIP testing also detected marked anisotropy, although it varied from point to point and was not systematic across the component. The anisotropy in this component arises from preferential alignment and inhomogeneous distribution of a hard “reinforcement”. The kind of effect that can arise during indentation of such material is illustrated by theSEM micrograph of an indent shown in Figure 6. The alignment of the “stringers”in this case is from top left to bottom right. It can be seen that small undulations have been created around the rim of the indent, which are primarily associated with the anisotropy.
Variations such as this have the potential to influence measured indent profiles. This is illustrated by Figure 7, which shows 4 profiles across another indent, oriented at 4 different angles. An average can be taken of such profiles, and this is likely to lead to adirection-averaged stress-strain curve that will be acceptably accurate. However, such variations can already be used to obtain information about local anisotropy, for example the direction parallel to the “stringers” is hardest as its profile has the lowest peak pile-up. In this way, a single indent has identified the presence and sense of anisotropy, without the need for machining separate samples.
Conclusion
The local plasticity variations were successfully characterised using PIP, including additional information about localised anisotropy. Variation was not detected with conventional tensile testing, while compression testing detected some differences due to its finer scale.
Overall, PIP required the least sample preparation and time for testing, while being the most successful technique for detecting localised variation.