Beyond Density:Achieving Optimal AM Parameters with Early Mechanical Property Testing
.jpg)

Introduction
In Additive Manufacturing (AM), parameter development is all about balancing performance, cost, and speed.
To save time and money, the conventional approach separates parameter down-selection from mechanical testing — relying heavily on density as a proxy for strength. But here’s the catch: density alone can be misleading. This shortcut often leads to poor material performance, unexpected failures, and expensive requalification cycles that wipe out the very savings it was meant to create.
What if AM engineers could assess both density and mechanical performance at the same early stage of the process? Could that unlock better materials, faster development, and fewer costly surprises?
.jpg)
Hardness numbers are produced by measuring the lateral extent or depth of an indent performed at a known load and applying a standard equation for the specific indenter used. These results are then frequently converted into UTS (ultimate tensile strength) and sometimes, albeit less frequently, yield stress values. Conversions can only be performed using empirical relationships, some of which can be found in standards published by ASTM and ISO.These standards contain warnings for the user, such as in BS EN ISO 18265:2013 where it states, ‘Conversion from one hardness value to a tensile strength value involves uncertainties which must be taken into account.’
These uncertainties include the relationship between hardness and UTS, which is only available for certain specific categories of alloy, which limits the use of these procedures to these metals. Despite this hardness data is often used extensively to inform design/safety decisions and as a material quality release test. This reliance on hardness numbers alone poses a problem for failure analysis and end users alike as it can lead to the need for approximations as well as a loss of potential significant information about the materials’ behaviour.
Challenge
Metal additive manufacturing machines offer numerous production parameters that influence the melting and solidification of each printed alloy.
For laser powder bed fusion (LPBF) these include laser power, scanning speed, layer thickness, and hatch distance, all of which can be adjusted independently, making effective parameter selection a complex, multi-variable challenge.
Getting it right, however, is worth it as the resulting parameter sets determine the thermal history that metals experience during production. This not only influences porosity, it also impacts the microstructure and resultant mechanical properties of the material.
Conventional parameter development approaches this challenge via a two-stage process:
Stage 1: Density Screening
The initial screening process relies on density as the only down-selection criteria. Typically, 20-50 small (1cm3) cubes are produced, each with a different set of parameters, to minimise printing and material costs. The parameter sets with the highest densities are assumed to represent the strongest and are therefore selected and used in the next stage of parameter optimisation.
Stage 2: Mechanical Property Assessment
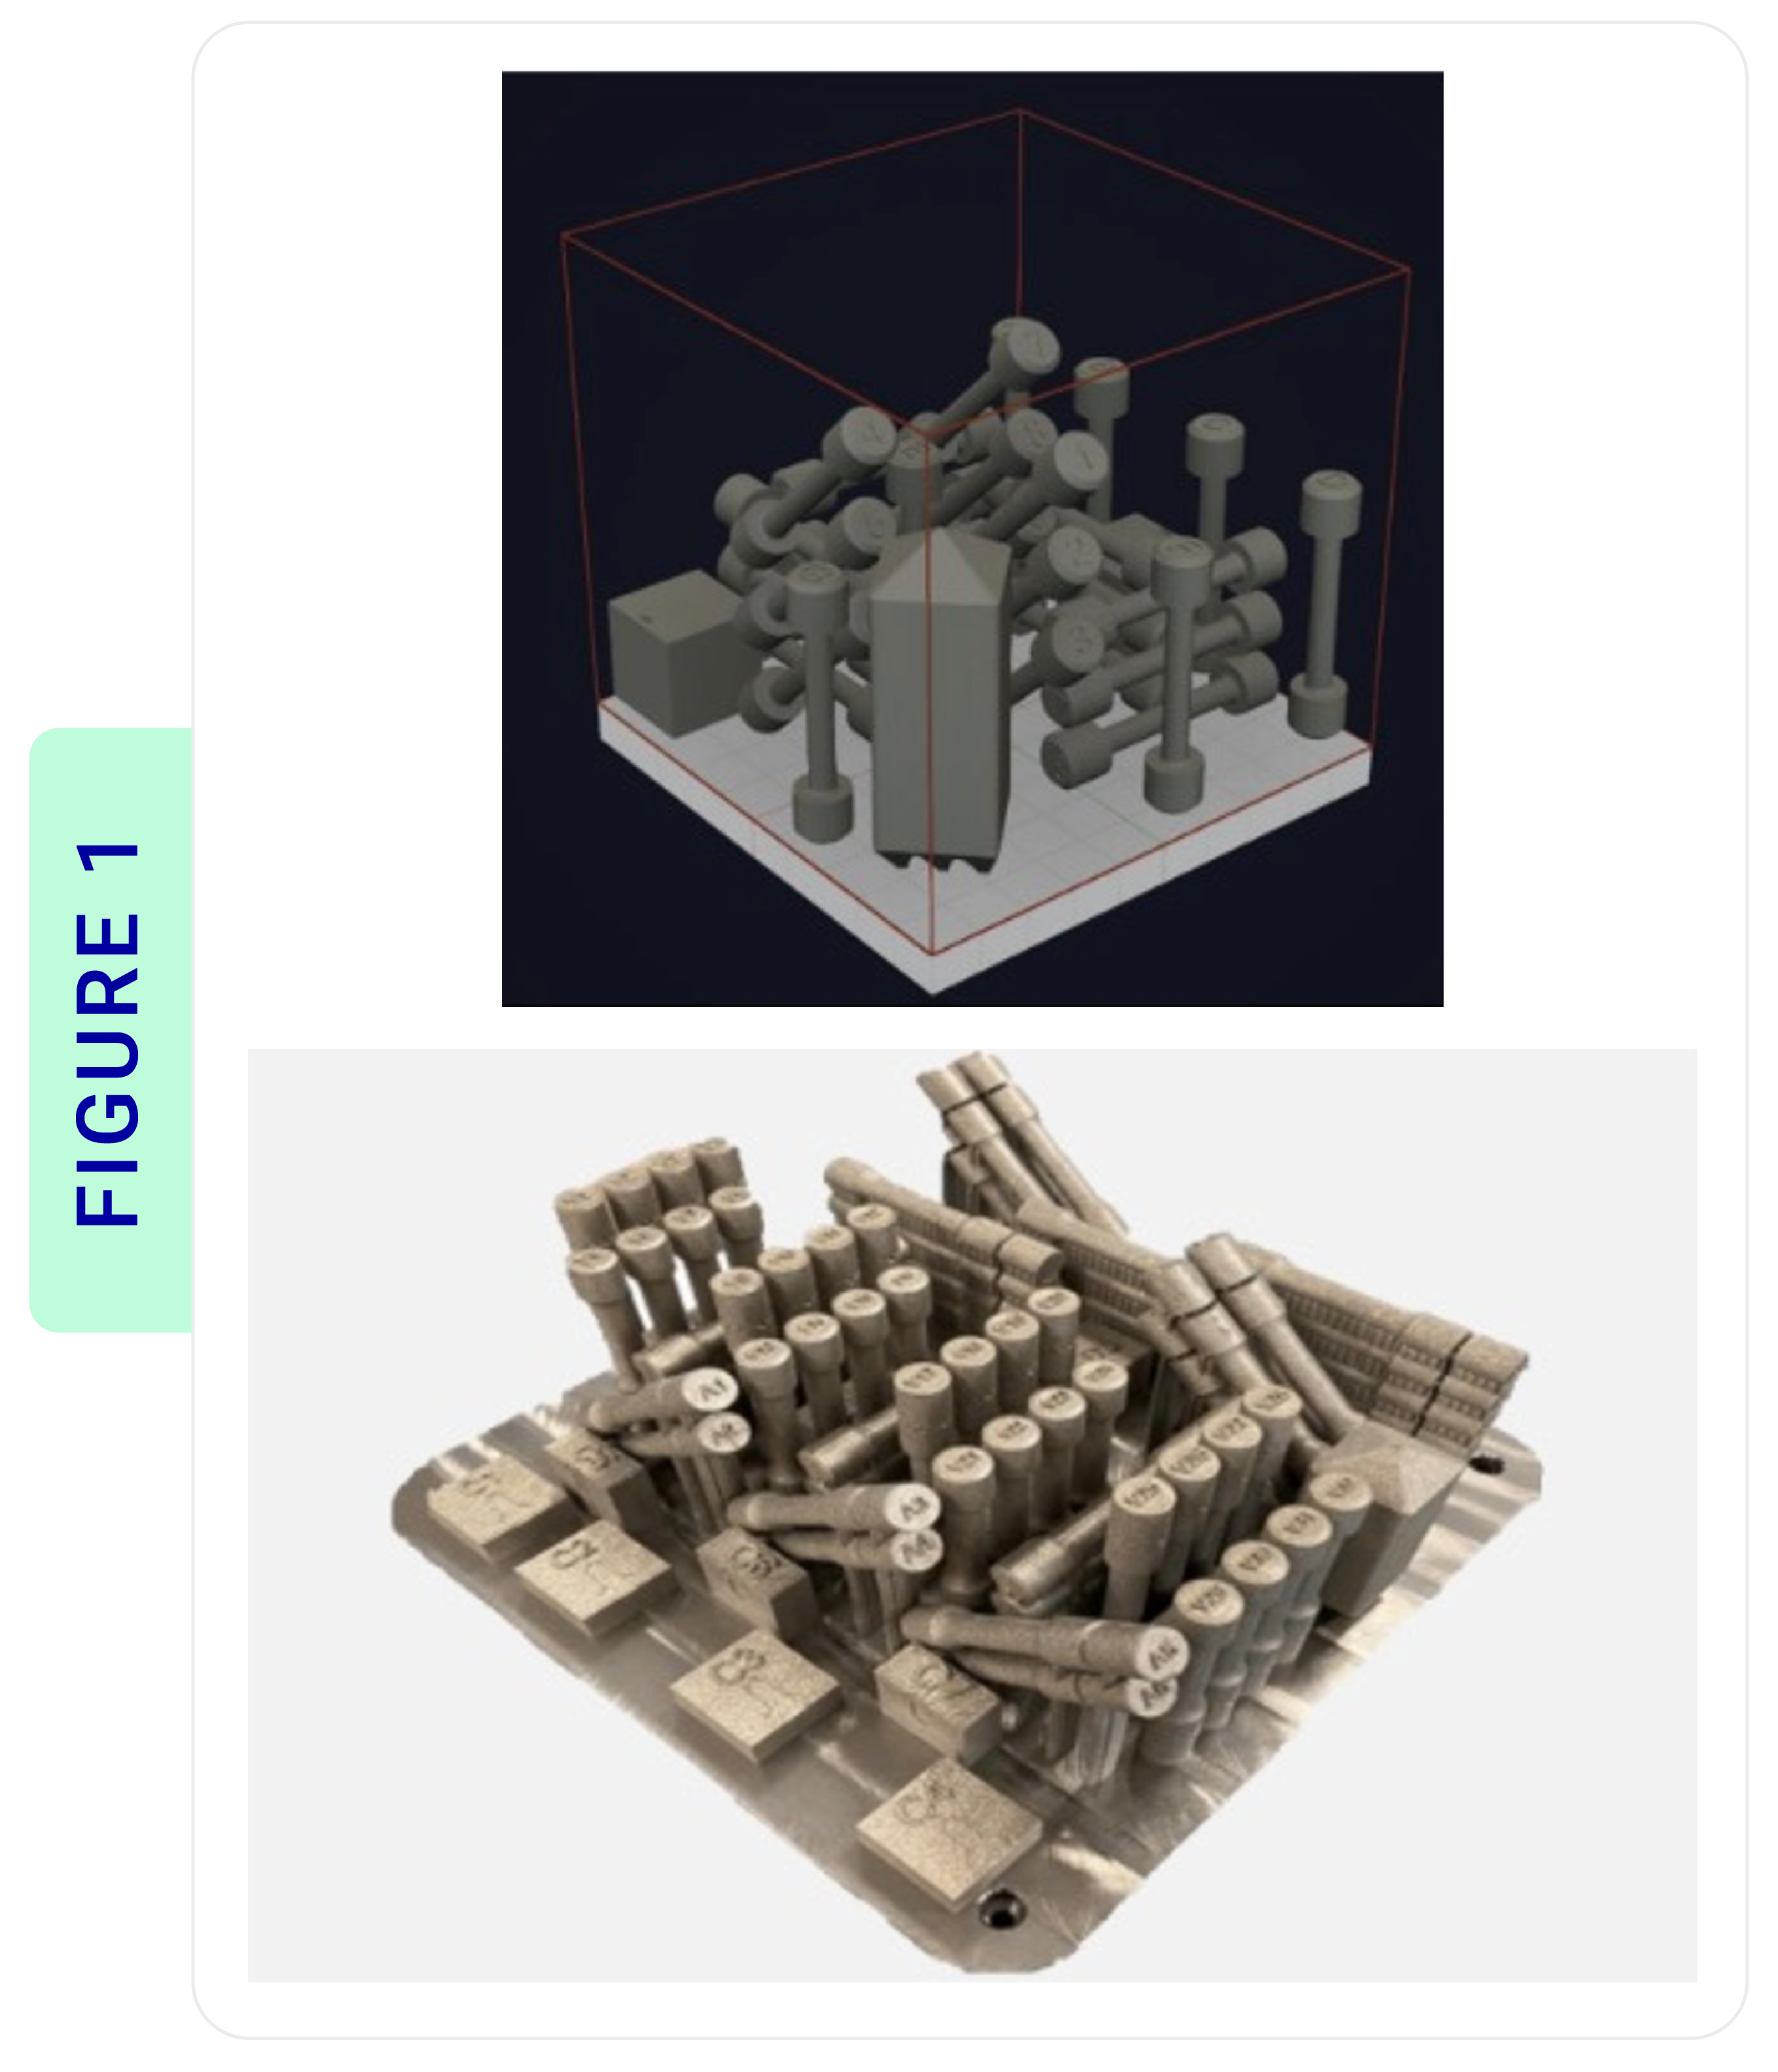
Once the most dense parameter sets are selected, the focus shifts to mechanical property assessment through uniaxial tensile testing. Large qualification builds, each containing multiple tensile specimens (Figure 1), are produced to evaluate whether the density-optimised parameters deliver adequate performance. To ensure statistical significance and high part confidence, it is best practice to collect 30 data points per condition.
(a) anXACT metal 200C
(b) a Renishaw 500Q.
Objectives
This case study, in collaboration with Additive Manufacturing Solutions, explores how PIP (Profilometry-based Indentation Plastometry) can reduce the resource risks of conventional parameter development by delivering fast, in-depth mechanical property data early in the process – using the same material already produced for density checks. With PIP testing, users can measure stress-strain curves from 1 cm3 density cubes, empowering engineers and scientists to select optimal printing parameters from a data set that includes both porosity and the fundamental mechanical properties (yield stress and ultimate tensile strength) of the material. Notably, PIP testing would enable users to differentiate samples based on mechanical data when parameter sets have similar density values.
Considering that a typical tensile coupon has a 30 times higher material volume than a 1cm3 density cube, the case for relying on density as a first step appears logical at first: This extra volume would make tensile testing for a wide range of parameters both time and cost prohibitive, with increased testing time, material and production costs.
However, this approach comes with considerable drawbacks:
1. Important trends between parameters and material properties are missed. Without comprehensive mechanical property data in the early phase of parameter development, optimal parameter sets that balance both density and material property combinations may not be uncovered.
2. Density alone doesn’t guarantee performance. It’s possible to pass early checks on density, only to fail mechanical property requirements later. When that happens, the entire qualification loop has to restart — new parameters, new builds, new tests, with each cycle costing $10k+ and weeks of engineering time.
(a) anXACT metal 200C
(b) a Renishaw 500Q.
Measurements
Optical density measurements were taken to measure the relative area of the pores. Images for these measurements were taken using a Nikon Eclipse Ci-POL camera, using ILASTIK1 that applies a machine learning pixel classification method and Image J2.
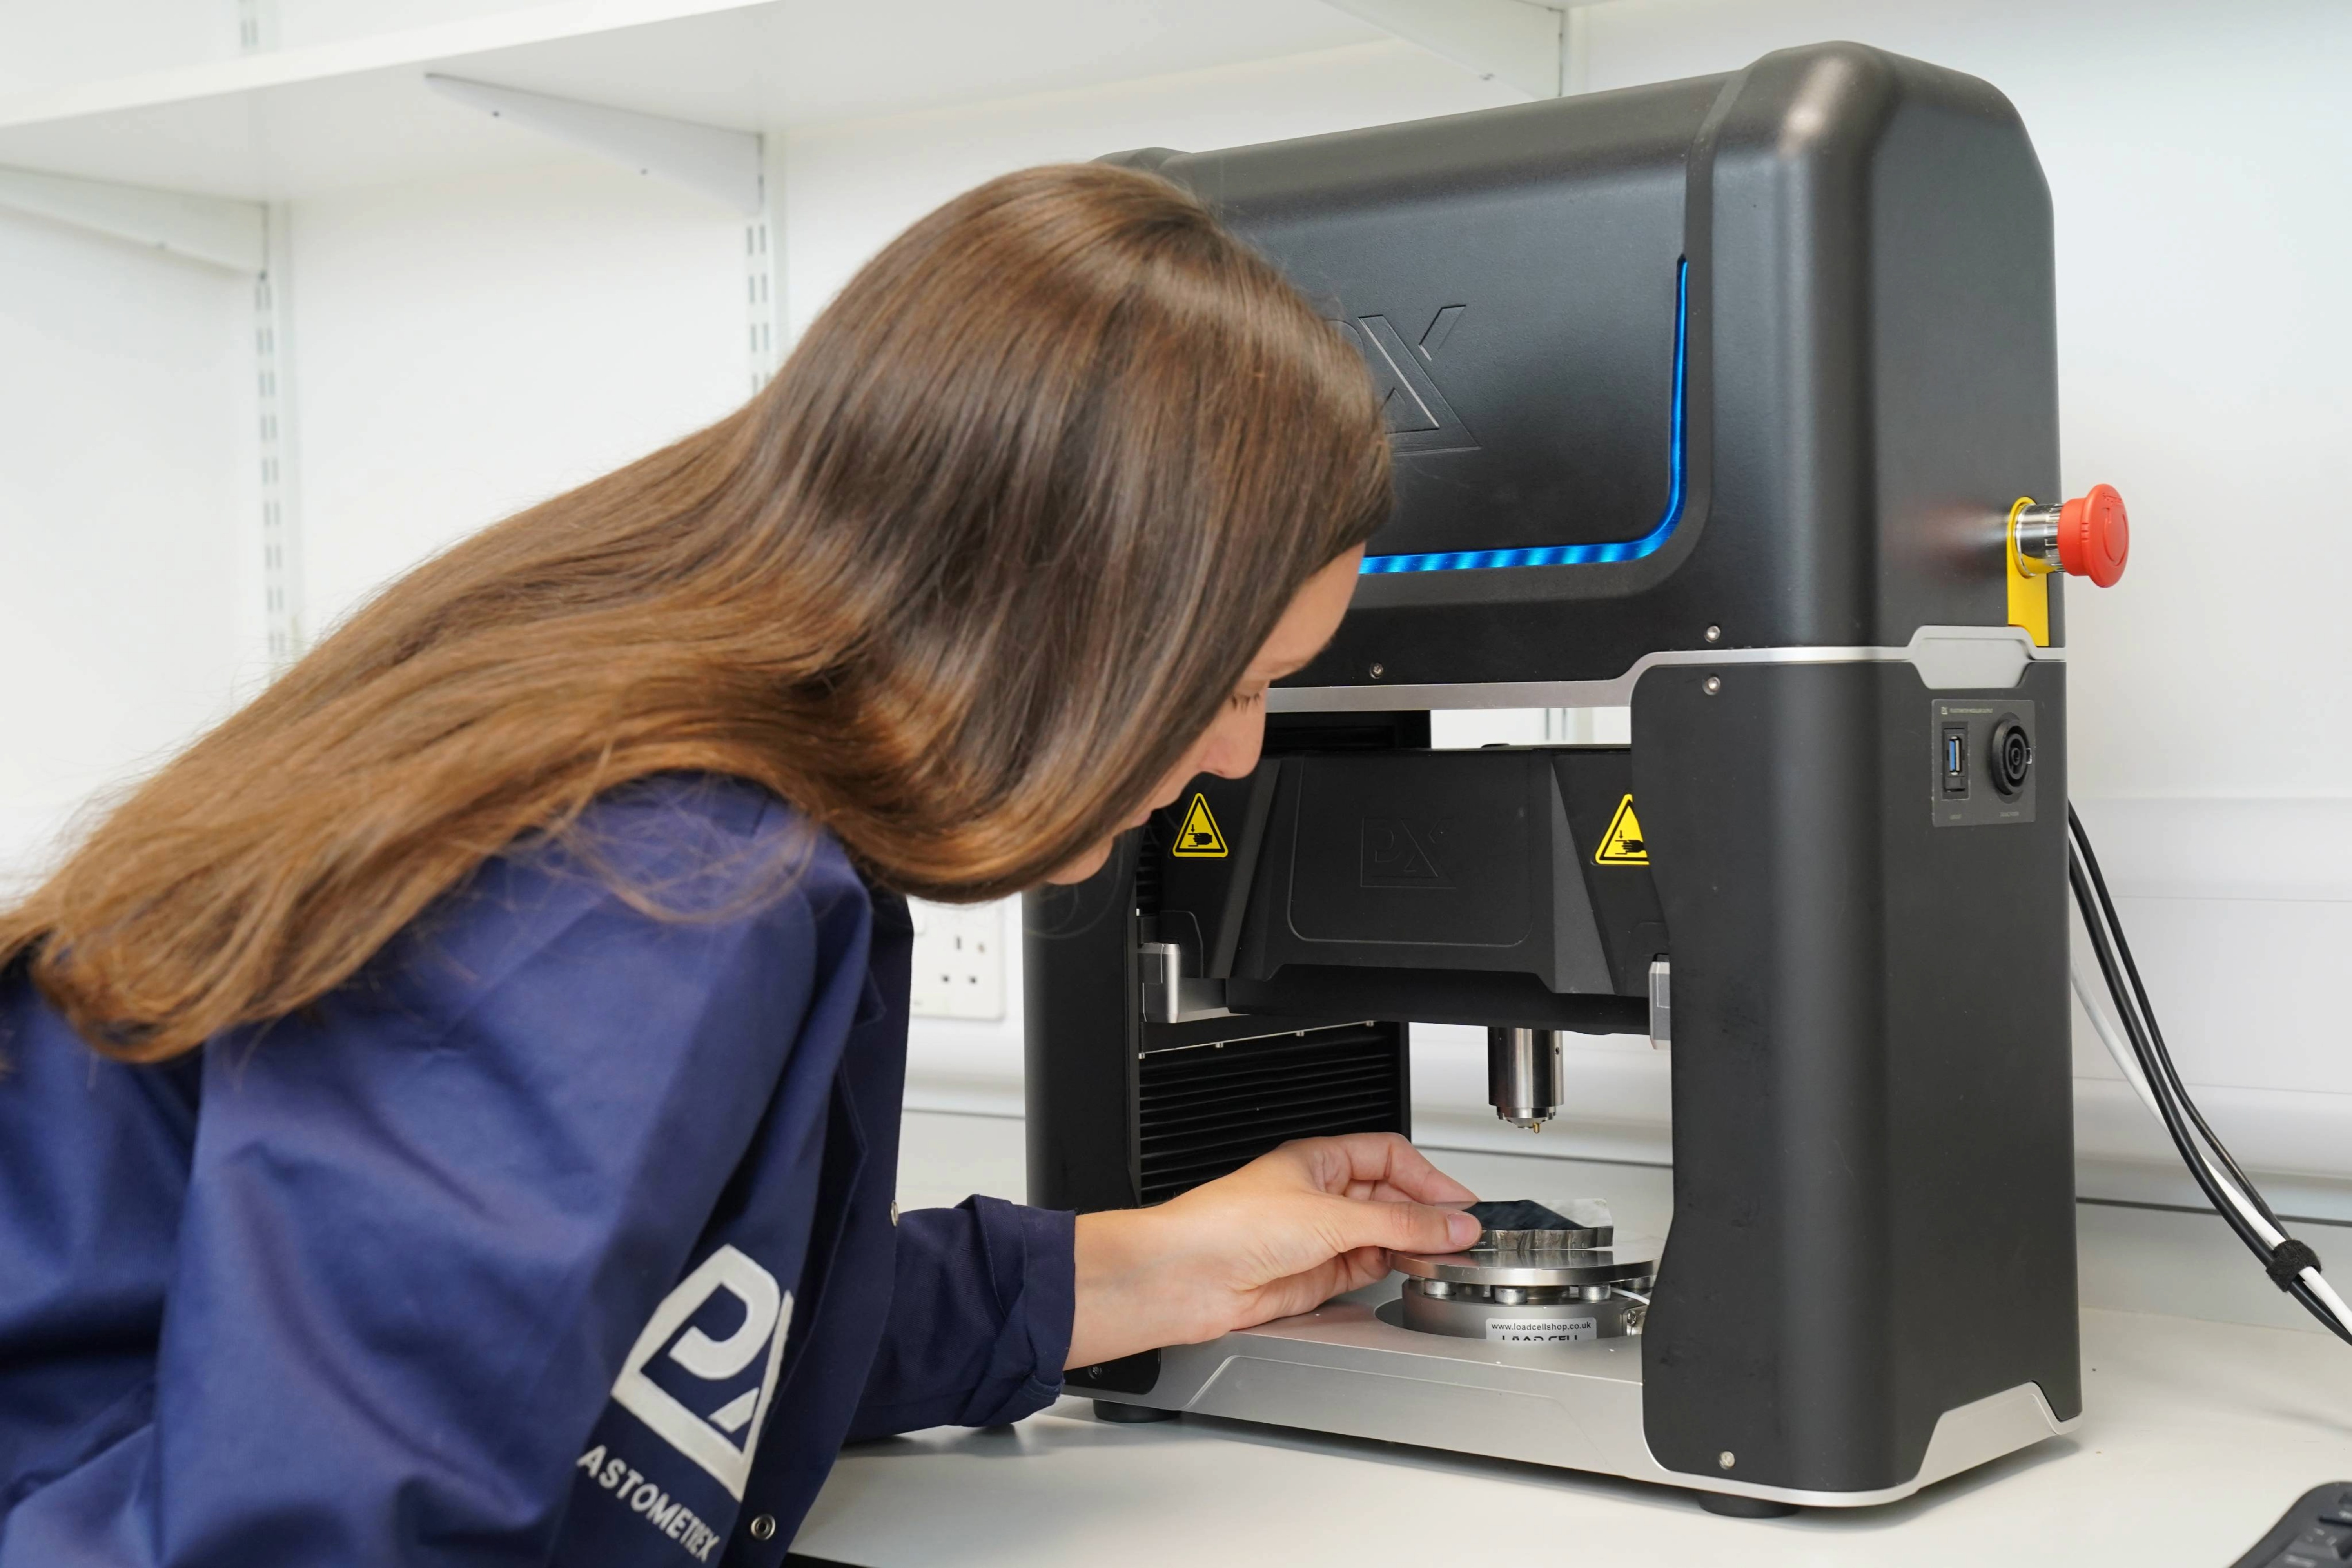
The mechanical properties were measured using the PLX-Benchtop, a compact indentation-based device for PIP testing. PIP uses an accelerated inverse finite element method to infer accurate stress-strain curves from indentation test data.
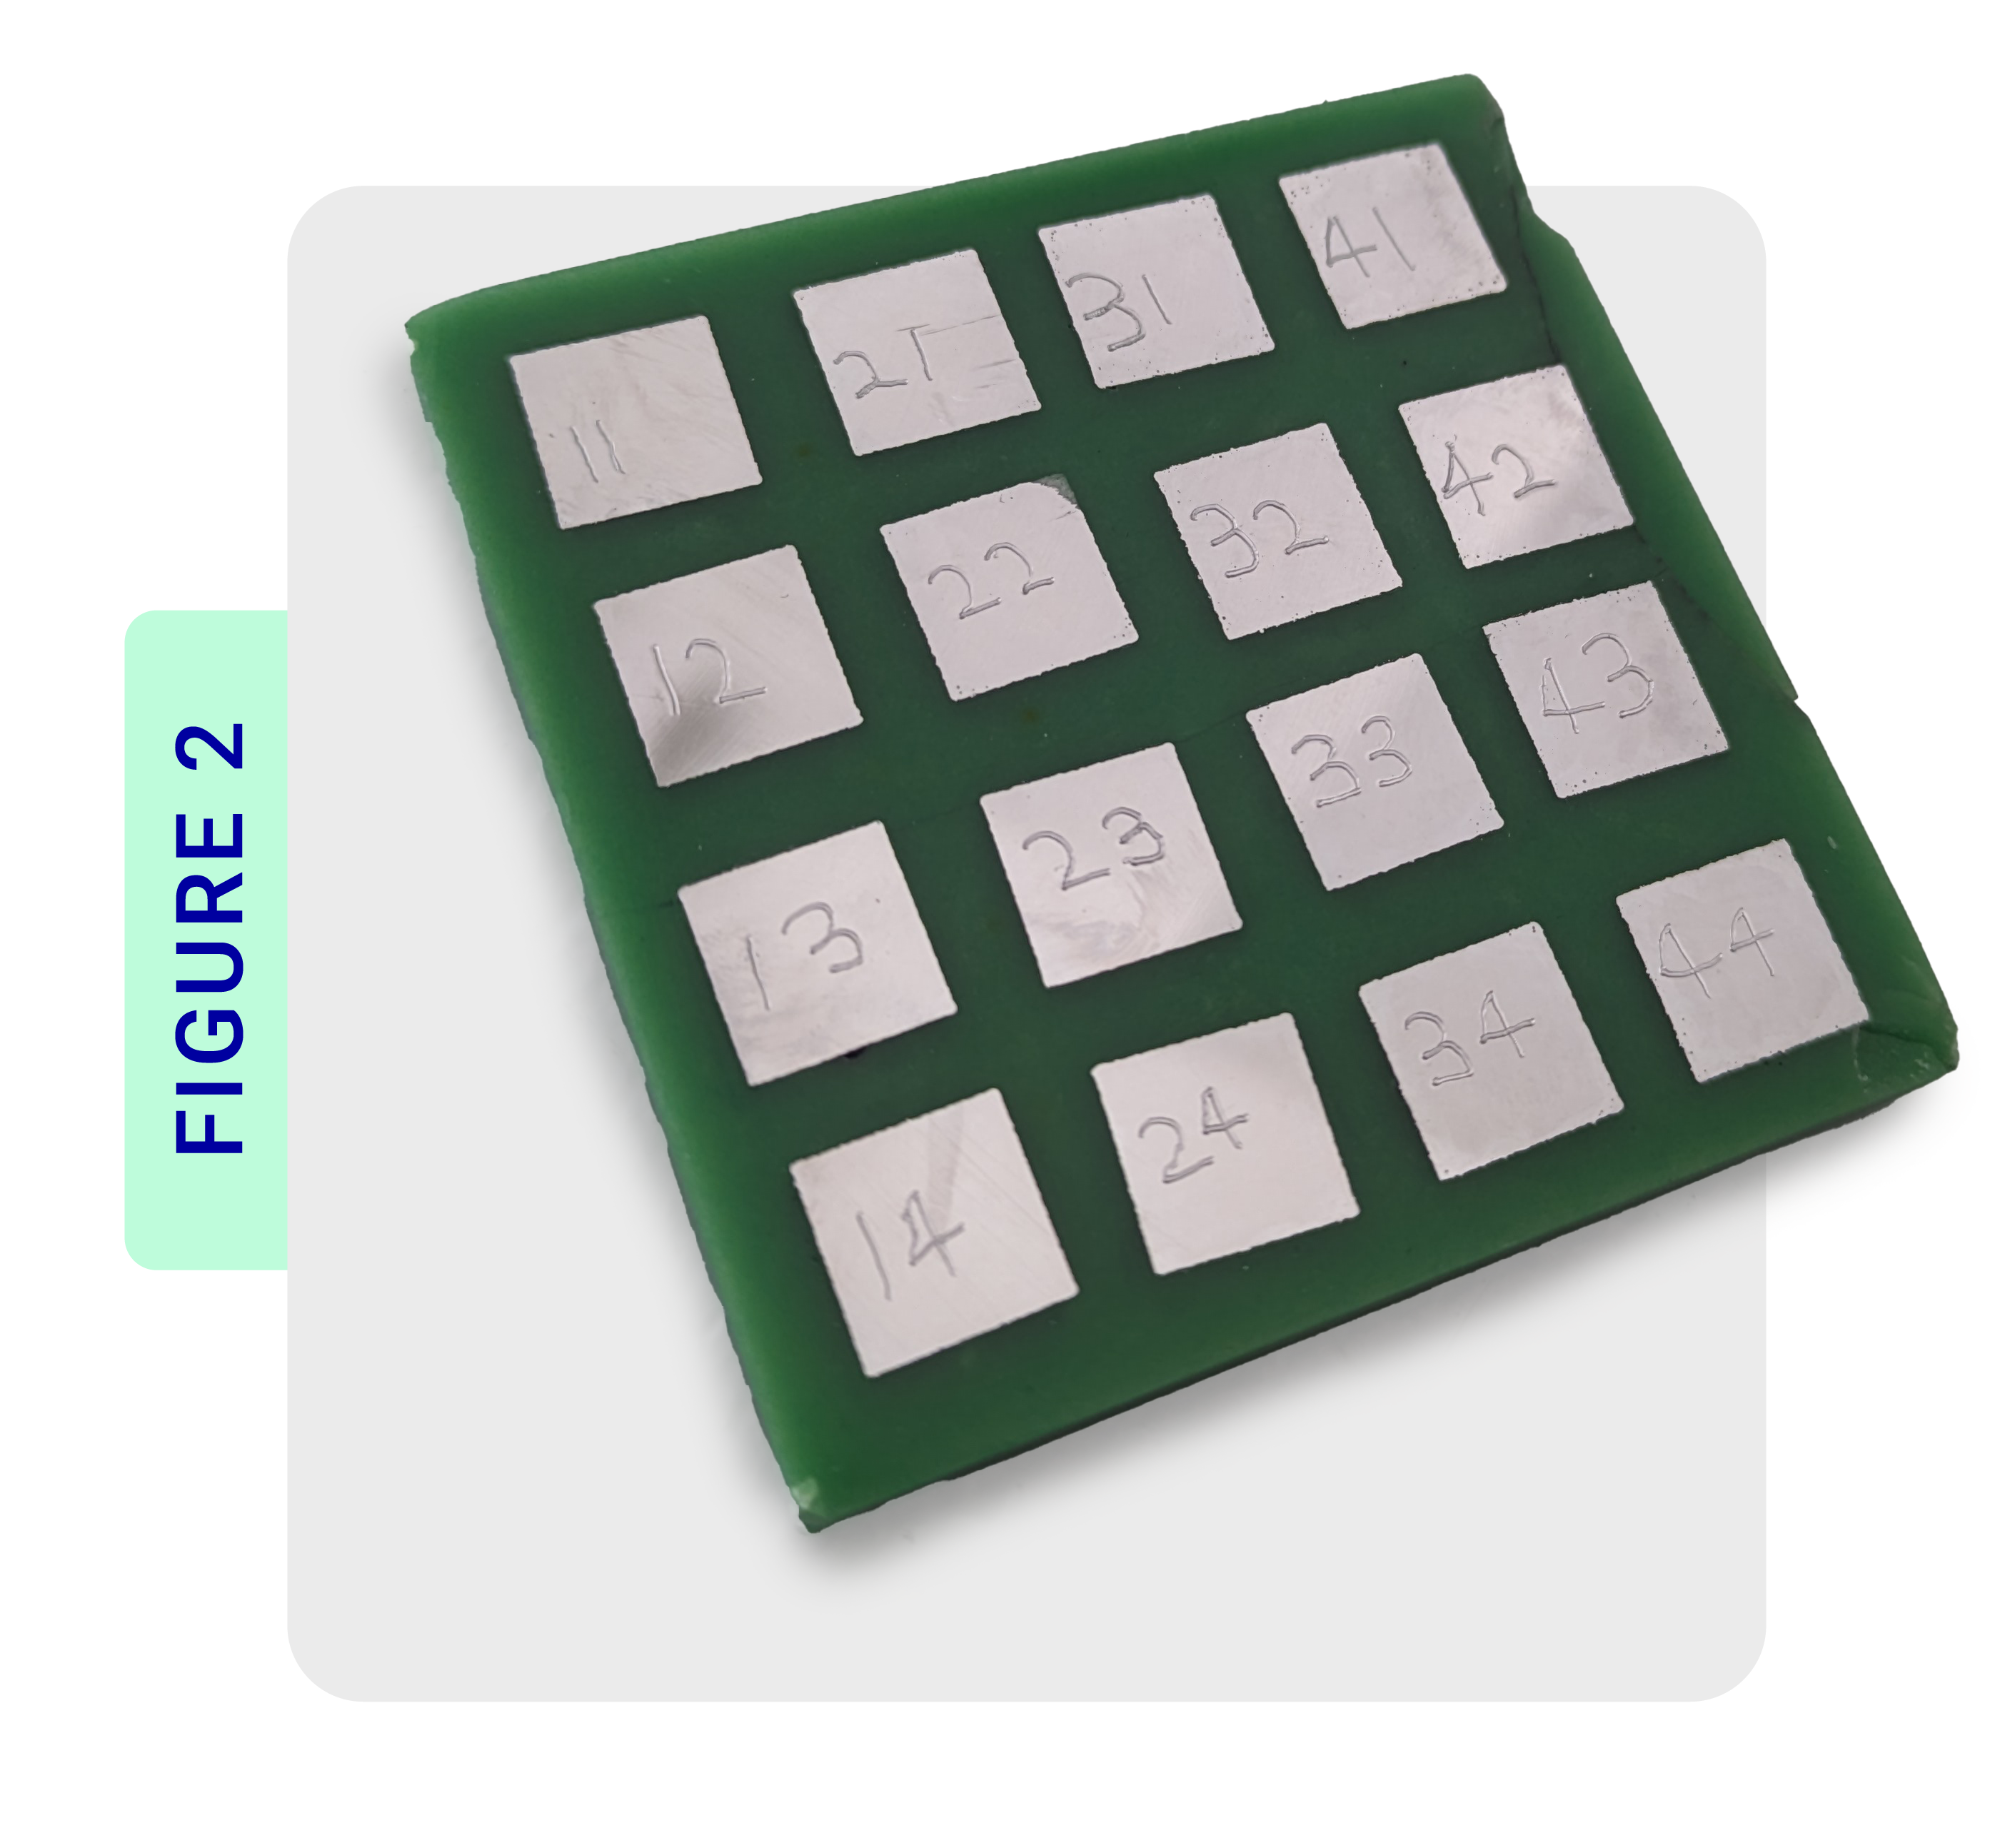
A standard PIP test uses a spherical indenter of 2 mm diameter and indents to a depth of 200 microns, which enables a test to be carried out directly on a 1 cm3 density cube. Only a P1200 micron grind (P600 in North American grade) is required for PIP testing, and tests take as little as five minutes, including sample preparation. In this study, 16 parameter cubes were mounted into a single sample array block using cold mount resin (image below). This array was then prepared on a grinding wheel as a single specimen, reducing the total preparation time to just 10 minutes.
Materials
AlSi10Mg was chosen as the example alloy for this work as it is a very common printing material, thereby requiring its parameterisation on many different machines.
In this study, the 16 samples were produced on an SLM solutions SLM 500 machine. Surfaces for indentation and microscopy were prepared to a 1 µm finish.
The printing parameters adopted in this work were chosen to cover a wide range of potential parameters:
- Laser power (W): 400, 475, 550, 625
- Scan speed (mm s-1): 1650 and 2000
- Layer thickness (μm): 30 and 60
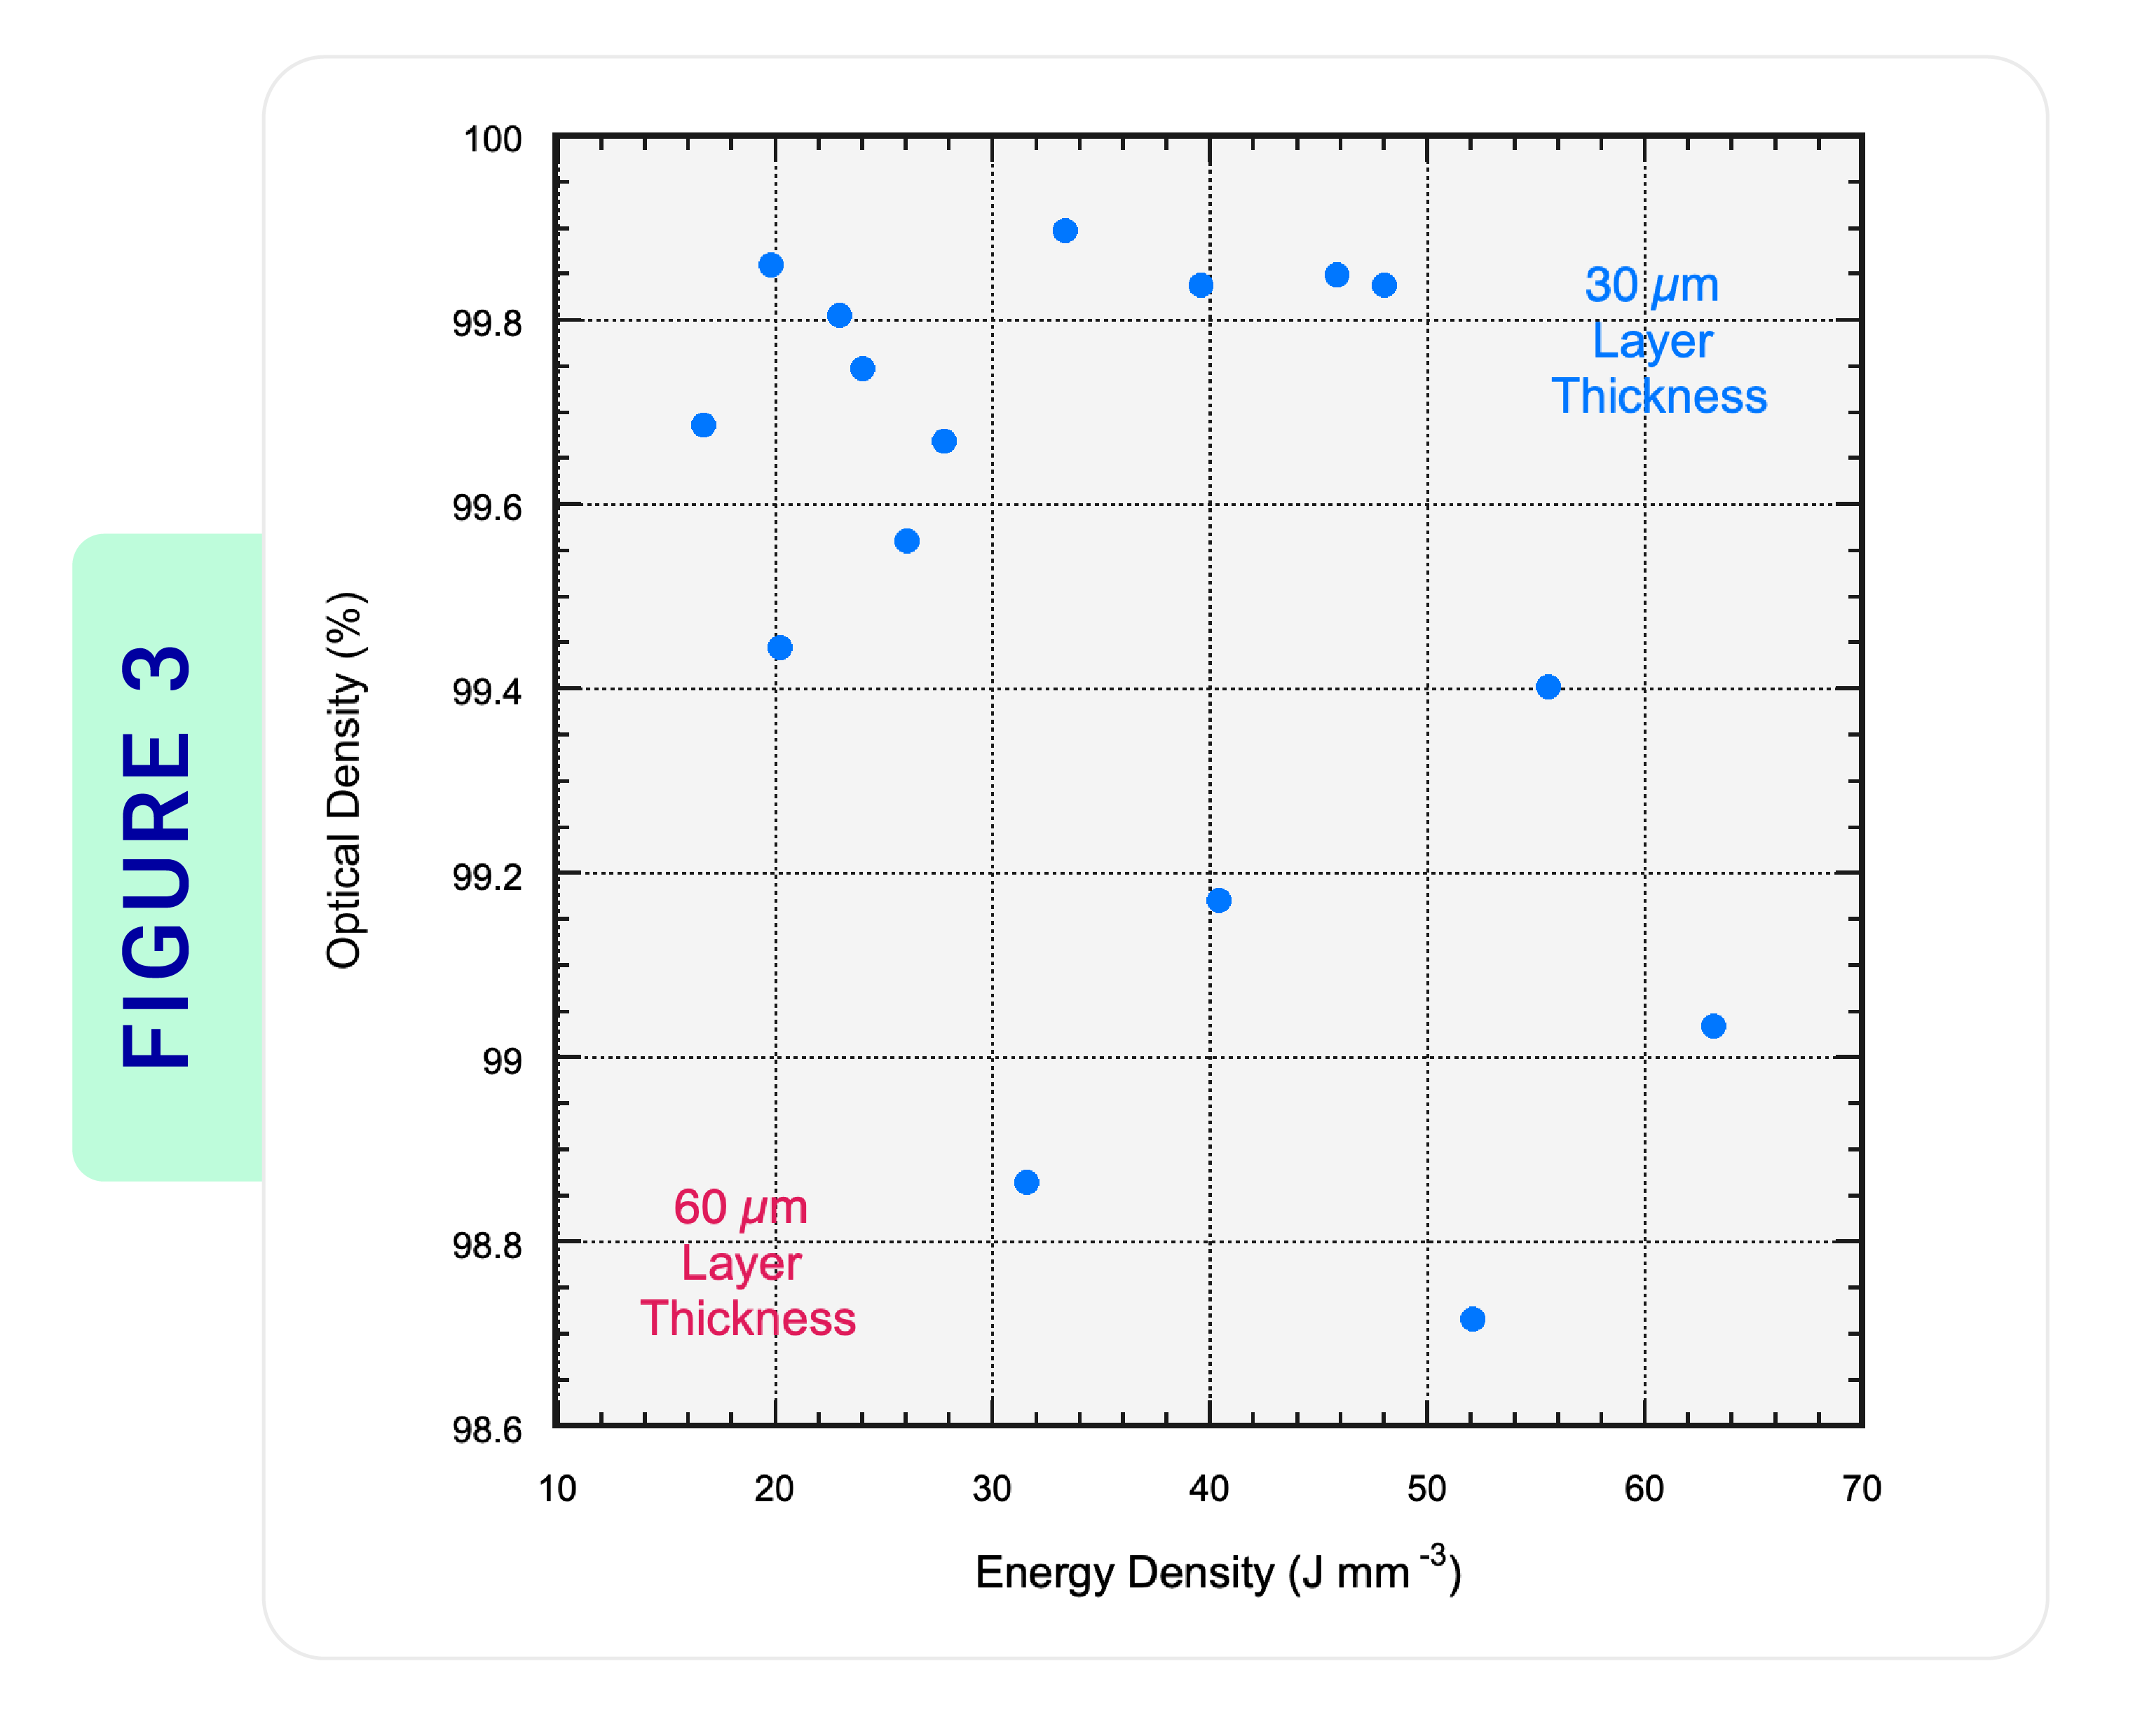
Figure 3: Plot of measured optical density as a function of energy density for the 16 different parameter combinations that were explored.
Results
The density of all cubes were initially measured and revealed that 14 of the 16 cubes had a density above 99% (Figure 3), making it difficult to determine which displayed optimal properties. Without corresponding mechanical property data, these parameter sets with similar density are virtually indistinguishable.
The next stage was then to determine how the strength of these parameter sets, with very similar density levels, might vary by obtaining mechanical properties. The conventional approach to establishing mechanical properties — printing numerous tensile coupons for each parameter set — would come with substantial cost and time requirements.
In contrast, PIP testing was easily performed on all 14 of the samples with less than 1% porosity. The tests were conducted directly on the density cubes, after minimal surface preparation.
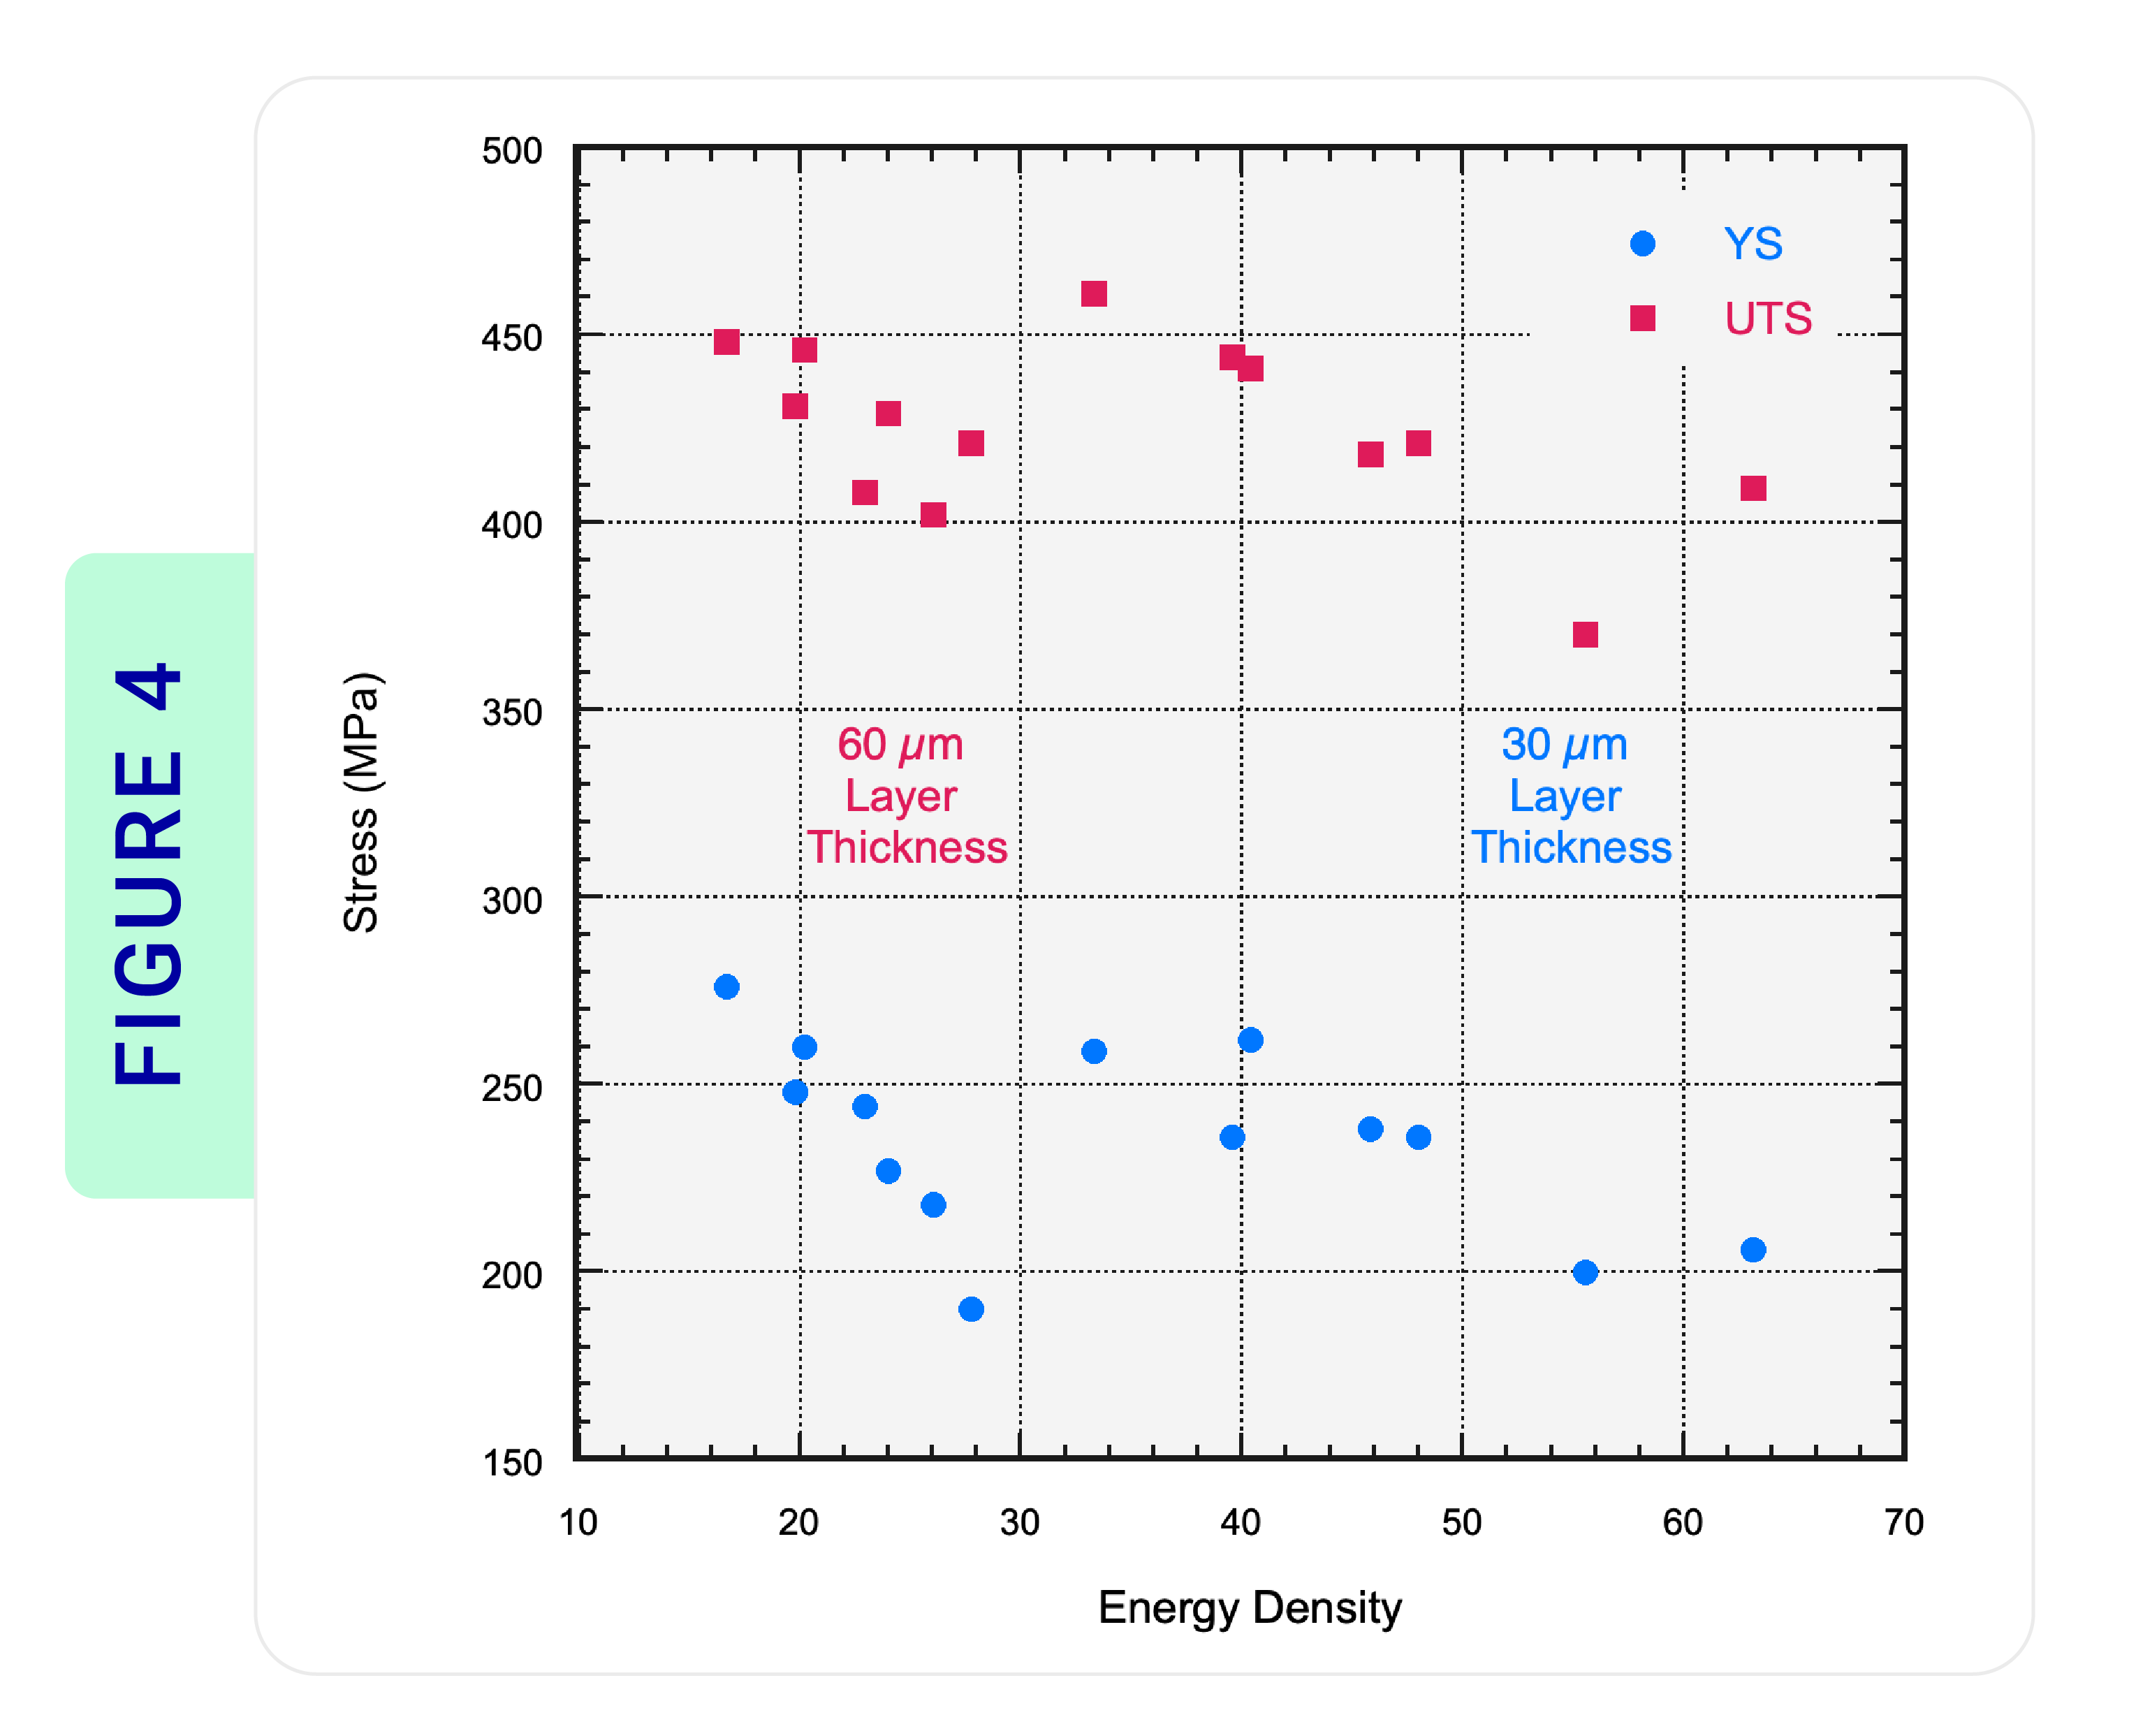
Figure 4: Plot of yield strength and UTS as a function of energy density for the 14 different parameter combinations that were explored.
Through the PIP tests, mechanical properties — namely yield and tensile strength — were obtained, alongside stress-strain curves. Figure 4 shows a full plot of yield strength and ultimate tensile strength (UTS) against energy density for the 14 samples with measured density above 99%.
This plot demonstrates the substantial impact energy density has on a material’s mechanical properties. By varying the processing conditions, such as laser parameters and layer thickness, the resulting melting and solidification conditions are likewise affected. This, in turn, alters the microstructure and ultimately results in different mechanical properties, something which the density checks were unable to uncover.
Across all samples, both the yield strength and UTS decrease as the energy density increases. As the energy density increases, larger melt pools — and likely re-melted layers — are produced. Consequently, this increases the solidification time, creating a coarser microstructure and resulting in suboptimal mechanical properties.
Figure 4 illustrates two key PIP findings:
1. Small differences in yield and tensile strength can easily be resolved between the samples.
2. By adjusting layer thickness, nearly equivalent mechanical properties can be obtained at both low and high energy density.
With this knowledge, engineers and scientists can easily save both time and cost by utilising larger layer thickness to reduce build time, while also achieving optimal mechanical properties.
This plot further demonstrates the dangers in relying on density to infer similarities in mechanical properties. In this instance, where 14 samples were over 99% dense, microstructural factors such as grain size and phase fractions heavily influenced their varied mechanical properties.
As shown, even for samples above 99% density, the ultimate tensile strength variation is almost 20% while the yield stress variation is greater than 45%.
Conclusion
With PIP testing, scientists and engineers can rapidly optimise build parameters from 1cm3 density cubes. This enables users to down-select parameters based on the ideal combination of both strength and density early in the development process: an exercise that was previously cost-prohibitive.
As this case study demonstrates, the mechanical properties across parameter sets with similar density values can vary dramatically. Consequently, density should not be used as the only down-selection criteria in cases where material strength is important.
If conventional tensile testing had been used, dozens of coupons would have needed to be printed in large builds, costing tens of thousands of pounds.
With PIP testing, this cost has been reduced by ~95%, and the printing time was slashed from over 46 hours to 9 hours. By cutting the associated costs, more tests can be performed, ensuring higher data confidence and more informed decision making.
By integrating PIP testing into parameter development, manufacturers gain a significant competitive advantage. This approach empowers AM teams to optimise mechanical properties efficiently, unlocking greater innovation, cost savings, and performance reliability in the rapidly evolving AM sector.