DEEP DIVE
Hardness testing has limits
The method is prized for being fast, affordable, and non-destructive. But hardness numbers are not fundamental material properties. Used as though they are, they can introduce unnecessary risk to engineering projects.
Here’s what the data shows.

Where hardness testing works
For fast quality checks, batch-to-batch comparison, and quality control on uniform materials, hardness testing earns its place in engineering workflows. The limitations emerge when it acts as a stand-in for missing mechanical data.

Can work for
Batch screening, heat treatment verification, incoming inspection, relative comparison under consistent conditions for uniform materials.

Breaks down for
Setting specification limits, deriving tensile properties, structural decisions, or comparing data across labs and instruments.
The trouble with hardness testing
Problems arise at the boundary between screening and characterisation. The method does not measure stress-strain response such as yielding or work hardening behaviours: key material property insights that are widely used to inform engineering decisions. Any link to strength relies entirely on empirical correlations which are not universal. Further, the link between hardness data and material strength depends on factors that are rarely reported alongside the number.
Load dependency
As load changes, so does the hardness value. That means two tests run on the same material and to the same standard, can return different hardness values.
Proxy correlations
Converting hardness to strength relies on empirical correlations. What works for uniform materials breaks down for welds, unusual microstructures, and non-standard processing routes.
Hidden variations
A uniform hardness map can hide non-uniform properties. Two regions with very different yield stresses and ductility can return the same hardness number.

The same material, but a 30% difference in measured hardness
ASTM E92 permits applied loads spanning more than five orders of magnitude, from 0.001 kgf to 120 kgf. The load used has a direct, systematic effect on the result.
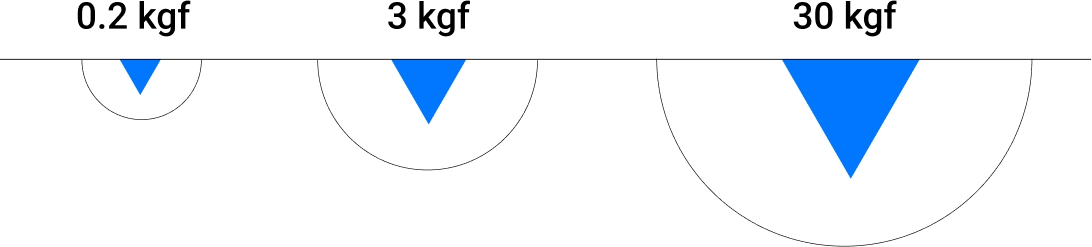
At lower loads, indent volumes are small enough that surface condition, grain boundaries, and near-surface deformation dominate the measurement. As load increases, the indent samples progressively more bulk material and measured hardness falls. The dependence is directional and consistent across materials.
When the applied load is not recorded alongside the value, as is frequently the case in datasheets and literature, there is no reliable basis for comparing results across labs or test configurations.
30%
variation in hardness within the ASTM E92 permitted load range
5
orders of magnitude span in permitted loads, from 1 gf to 120 kgf
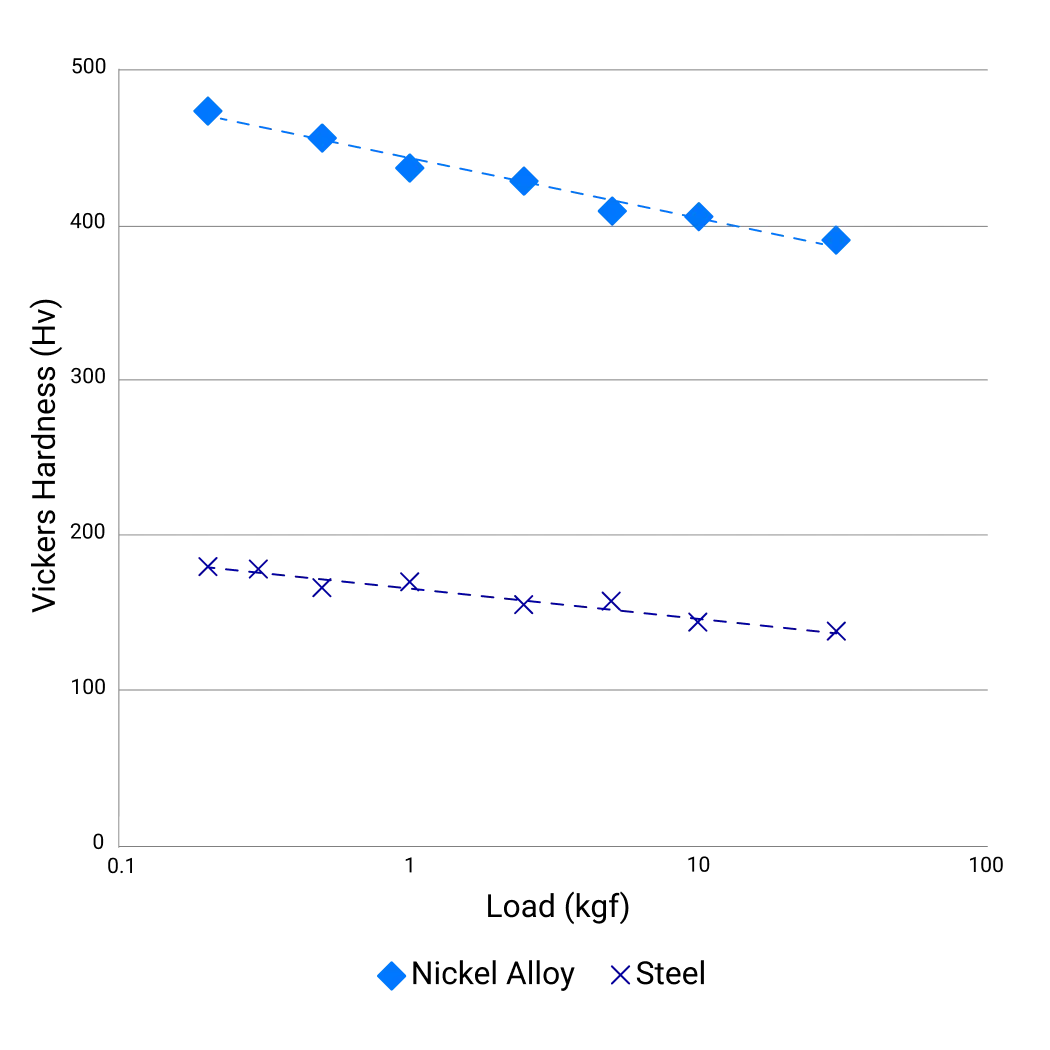
Illustrative trend based on case study data.
Both materials show a systematic decrease in measured hardness as applied load increases from 0.2 kgf to 30 kgf.
~30%
deviations in hardness inferred yield stresses
±85 MPa
uncertainty band built into ISO 18265:2013 for hardness-to-strength conversion

A hardness number is a proxy measurement, not a universal value
The correlation between hardness and tensile strength is dependent on factors such as the load used during testing, material, microstructure, and processing history. This means that the data only stands up for some materials under some conditions.
Hardness data can shape engineering assumptions that play a key part in decision making: influencing safety margins, qualification strategies, and understanding of part performance. This can lead to misplaced confidence or unnecessary conservatism.
In collaboration with Health & Safety Executive, a comparison across 12 alloys, including steels, stainless steel, copper, aluminium 7075, and the nickel superalloy Waspaloy, measured how closely hardness-converted strength values and directly-measured strength values matched true tensile results. The findings? Only 7 of the 12 were suitable for ISO18265.
A uniform hardness map is not evidence of uniform mechanical properties
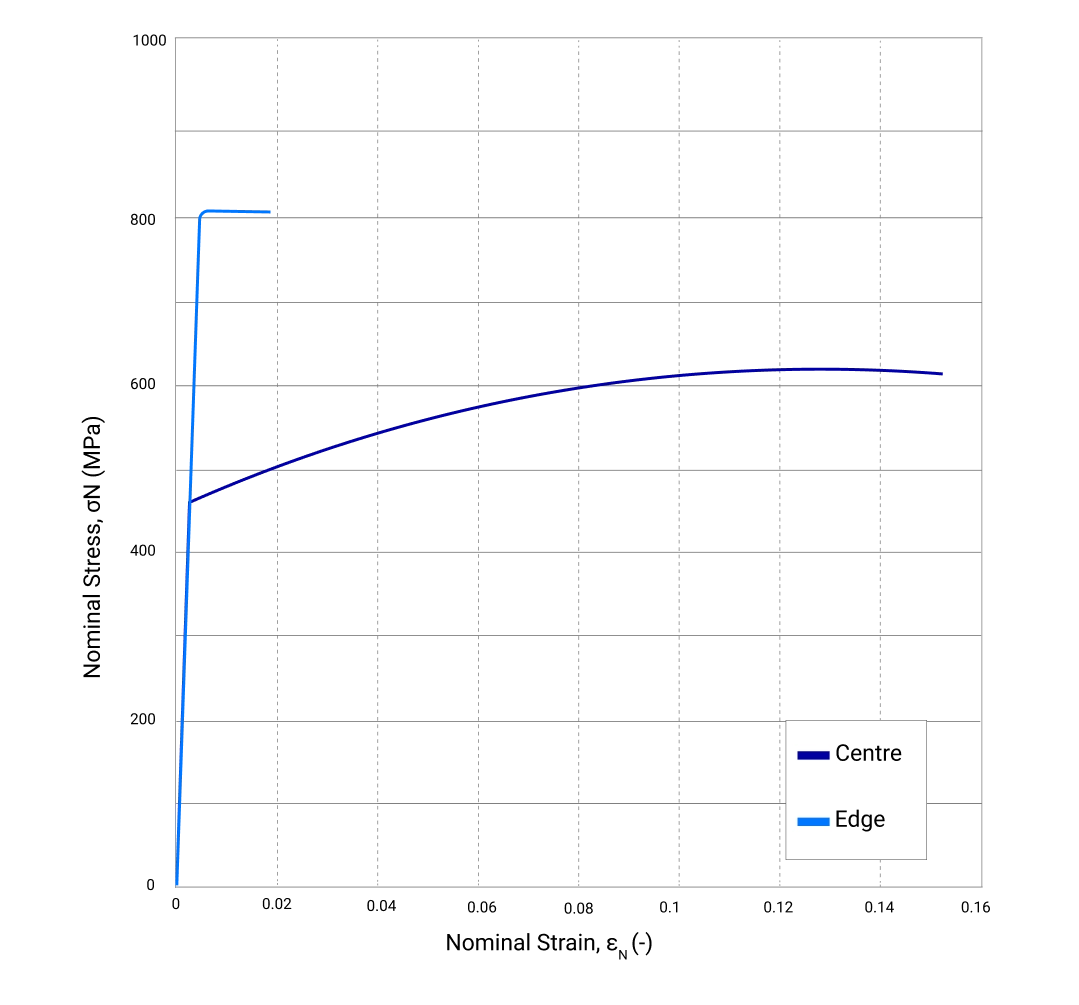
Hardness captures resistance to localised plastic deformation at the surface, at a specific load and scale. Two regions with substantially different yield stresses or work hardening rates can return indistinguishable hardness numbers.
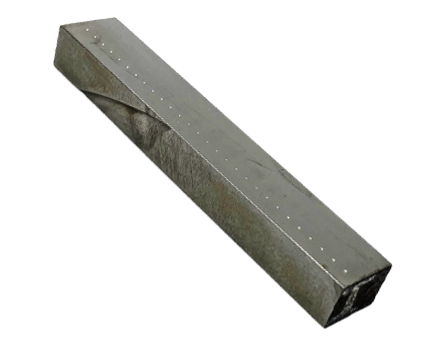
In heat-affected zones, cold-worked regions, and microstructurally graded components, a uniform hardness map can obscure meaningful variation in the properties that govern fatigue life, fracture resistance, and plastic instability. In this example for a rolled steel section mapped across the thickness, hardness detected that properties varied towards the edge but couldn’t provide any data on work hardening.
11x
higher strain to necking at centre compared with the edge
Need unambiguous mechanical data?
Profilometry-based Indentation Plastometry (PIP Testing) provides direct access to yield stress, work hardening behaviour, and ultimate tensile strength from a single non-destructive indent. All data is measured, not inferred, and independent of indenter scale.