Hardness testing is quick, cheap and portable, yet the number it produces varies with the type of test and the conditions under which that test is run. This guide explains how indentation hardness numbers are obtained and works through the Brinell, Rockwell, Vickers and Knoop tests, covering indenter geometry, load effects, pile-up and sink-in, and the shaky basis of hardness-to-yield-stress conversions. It also looks at how grain structure and anisotropy affect the result, and at how indentation plastometry infers a full stress-strain curve from a single indent.
Hardness test procedures of various types have been in use for many decades.
They are usually quick and easy to carry out, the equipment required is relatively simple and cheap and there are portable machines that allow in situ measurements to be made on components in service.The volume of material being tested is relatively small, so it's possible to map the hardness number across surfaces, exploring local variations, and to obtain values from thin surface layers and coatings.
The main problem with hardness is that it's not a well–defined property. The value obtained during testing of a given sample is different for different types of test, and also for the same test with different conditions.
Identical hardness numbers can be obtained from materials exhibiting a wide range of yielding and work hardening characteristics. The reasons for this are well established. There have been many attempts to extract meaningful plasticity parameters, particularly the yield stress, from hardness numbers, but these are mostly based on neglect of work hardening.
In practice, materials that exhibit no work hardening at all are rare and indeed quantification of the work hardening behaviour of a metal is a central objective of plasticity testing. The status of hardness testing is thus one of being a technique that is convenient and widely used, but the results obtained from it should be regarded as no better than semi-quantitative.
There are procedures and protocols in which they are accorded a higher significance than this, but this is an unsound approach.
Concept of a Hardness Number (Obtained by Indentation)
Systematic attempts to characterise the hardness (resistance to plastic deformation) of materials can be traced back[1] to the proposal in 1812 by the Austrian mineralogist Friedrich Mohs that the capacity of one material to scratch another could be used as a basis for a ranking order.
Suggestions of using a single hard indenter on a range of metals date back [1] to the work of William Wade in 1856, oriented towards optimising materials for production of cannons. Commercial set-ups for testing hardness in this way started to become available around the beginning of the 20th Century. It was, however, several decades before serious attempts were made to establish a sound theoretical background to this type of testing[2–4].
Hardness is a measure of the resistance that a material offers to plastic deformation. It's of interest to have information, not only about the yield stress, but also about the subsequent work hardening characteristics. The hardness number provides a yardstick that incorporates both, although not in a well-defined manner. In view of the complexity of what it represents, it's unsurprising that hardness is not a simple, well-defined parameter and there are several different hardness measurement schemes, each giving different numbers.
The idea, however, is the same for all of these schemes. A specified load is applied to an indenter, which penetrates into the specimen, causing plastic deformation and leaving a permanent depression. A hardness number can be obtained in several ways, but in most cases this is either via measurement of the indent lateral size (diameter) or of the penetration depth.
Hardness is commonly defined as the force(load) divided by the area of contact between indenter and specimen (although this is not the case for all schemes – for example, see 2.2 below). This ratio has dimensions of stress, although it is usually quoted as simply a number(with units of kgf mm-2). In any event, this stress level bears no simple relation to the stress-strain curve, or indeed to the stress field created in the sample. Different regions of the specimen will have been subjected to different plastic strain levels, ranging from zero (at the edge of the plastic zone) to perhaps several tens of % (close to the indenter). Even this maximum strain level is not well defined, since it depends on the indenter shape, the applied load and the plasticity characteristics. While the stress-strain relationship of the material does dictate the indent dimensions (for a given indenter shape and load), inferring the former from the latter is not straightforward and no attempt is made to do this in conventional hardness testing.
Indenter shapes can be grouped into two broad classes, on the basis of whether or not they are “self-similar”. A self-similar shape is one for which the geometry of an axial section through the indenter(and sample) remains unchanged, apart from its scale, as penetration occurs.Characteristics of such shapes include the fact that the ratio of contact area to depth is constant (for a given shape, and ignoring effects of “pile-up” or“sink-in” around the indenter). There is thus no “scale effect”. Most indenter shapes in which the sides are linear in an axial section are self-similar. The most commonly encountered indenter shape that is not self-similar is that of a sphere, for which the ratio of contact area to depth is given by 2πR, where R is the radius of the indenter.
A related concept is that of the “area function” of an indenter [5]. This gives the actual contact area, as a function of the depth, for a particular shape, potentially taking account of factors such as elastic recovery and the effect of pile-up or sink-in, and perhaps also the actual shape right at the tip of a “sharp” indenter. It can be estimated in various ways for shapes that are self-similar (in which case the area/depth ratio should be constant on a simple geometric basis) and for those that are not.The attraction of this is that, with depth-sensing equipment, the contact area(and hence the hardness) can be obtained without the need for measurement of lateral dimensions of the indent, which is the “traditional” approach to measurement of hardness. In practice, both self-similar and non self-similar indenter shapes are used in hardness testing. A brief description is provided below of the main tests (in chronological order of their development).
Indentation Hardness Tests
2.1 The Brinell Test
The Brinell test, developed in 1900, involves pushing a 10 mm diameter hard sphere into the sample, using a 3000 kg (~30 kN)load.
It is oriented towards steels and is not suitable for much softer metals. A photo of a typical Brinell testing machine is shown in Fig.1. At the front in the upper part is a device for measuring the indent diameter (via an optical microscope). The Brinell hardness number is given by:
HB = 2F / (πD [D – √(D² – d²)])
where F is the applied load (in kgf), D (mm)is the diameter of the indenter and d (mm) is the diameter (in projection view)of the indent. This formula corresponds to the load divided by the contact area(with the units being kgf mm-2) and indeed this is how most hardness numbers are defined. Such formulae are based on a simple geometric approach. Elastic recovery of the specimen is neglected. Furthermore, in practice there may be“pile-up” or “sink-in” around the indent, such that the true area of contact differs from that obtained from idealised geometry (and also making accurate measurement of the diameter difficult – see below). No account is normally taken of such effects.
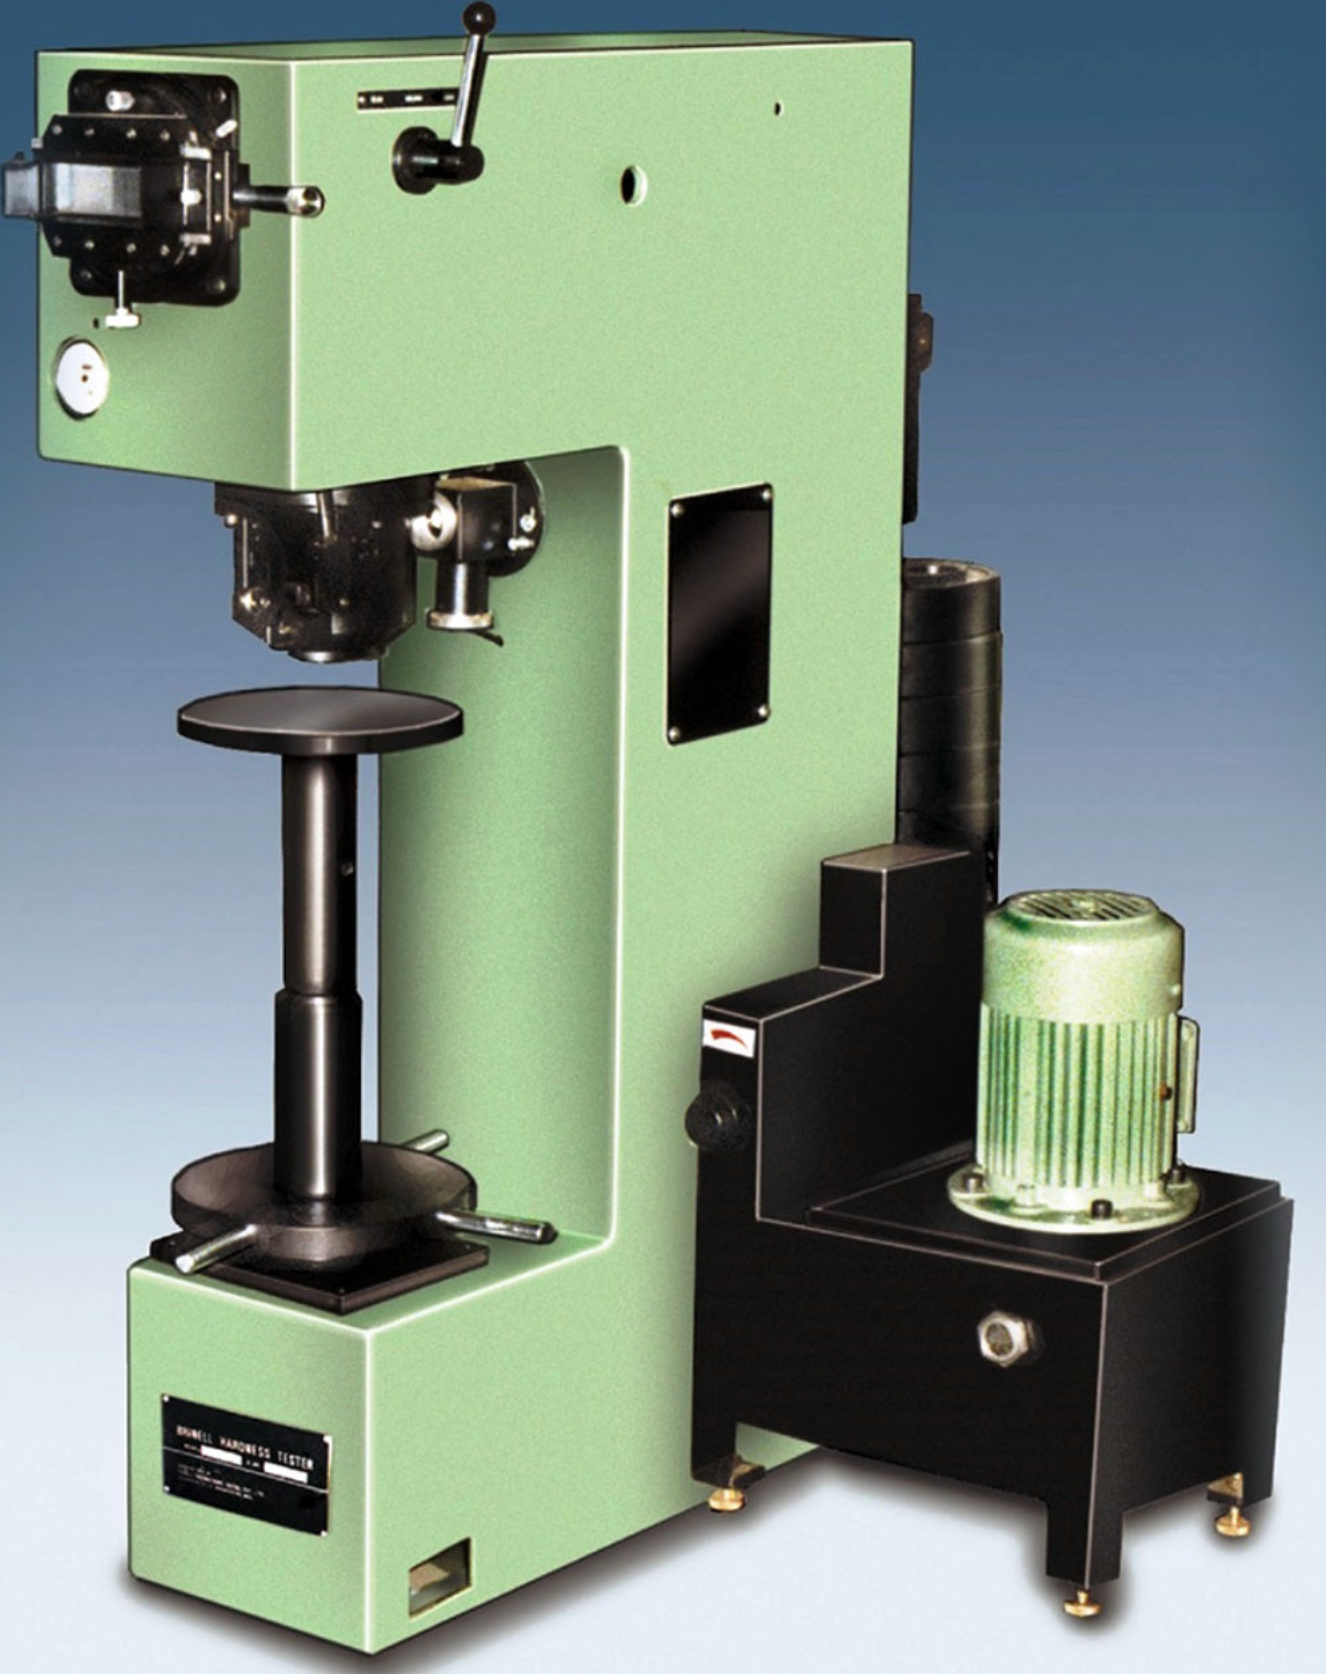
Numbers obtained in different types of(indentation) hardness tests are significantly different. This is unsurprising in view of the dependence of plastic strains on indenter shape and applied load, as well as on the plasticity characteristics of the material. One issue with hardness testing is that, since the load affects the hardness number, it should always be provided when quoting one (but often is not). At least with the Brinell test this is unnecessary (since the load is normally fixed). It is a high load, so a substantial loading frame and load generation system (often hydraulic) are required.
One rather ironic aspect of the Brinell test, given that it was more or less the first one, is that, while the limitations relating to obtaining well-defined plasticity characteristics from it do apply equally to all hardness tests, it does at least involve the mechanical interrogation of a relatively large (and hence “representative”) volume of the sample. The large (10 mm) diameter of the ball ensures that, at least in the vast majority of cases, this volume will contain many grains.
It was recognised at an early stage that this was an advantage for testing of “heterogeneous” materials. However, the large indent size was also regarded as a disadvantage, because it meant that the test couldn't really be described as “non-destructive”. When applied to a component in service, the residual indent was (and is) seen as potentially a significant defect. It also requires a set-up with a relatively high load capability. Most of the other hardness tests, and indeed much of the more recent indentation work generally, have moved to creation of progressively smaller indents. This has often had the effect of creating outcomes that cannot be regarded as representative of the plasticity of the bulk material – for example, the indents may lie within single grains, or perhaps just deform a small assembly of them. It's worth noting in this context that the indentation plastometry technique involves use of an indenter with a diameter (~1 mm) that is large enough to ensure that the outcome reflects the bulk plasticity, at least inmost cases, but creates much smaller indents than the Brinell test, and hence can safely be regarded as “non-destructive”.
Complex mathematical treatments [6–8] have been published relating to the Brinell test (and indeed to some of the other tests as well), covering both analytical treatments and the outcomes of FEM modelling.Unfortunately, obtaining analytical solutions of any sort concerning such tests usually requires rather unrealistic assumptions, such as neglect of elastic recovery, work hardening, interfacial friction, surface topographies etc.Sensitivities are often such that qualitatively incorrect deductions can be made when such simplifications are employed. FEM modelling, in which it's not necessary to impose unrealistic boundary conditions, and for which the (true)stress-strain relationship employed can be expressed either as a set of data-pairs or as a constitutive law, does not suffer from these limitations. It therefore tends to be the most effective way of investigating the actual behaviour of a sample during such a test, although the identification of underlying characteristics can then be a rather cumbersome operation.
Some outcomes of such modelling of the Brinell test are shown below, for Mangalloy and a duplex stainless steel. One point of interest is what hardness numbers would be obtained from these indents, if measured conventionally. Profiles are shown in Fig.2 for these two steels, with3 different applied loads. As for most indents, there is a degree of pile-up(greater for metals exhibiting less work hardening – ie for the duplex stainless in this case). In both cases, however, formation of a pile-up (or sink-in) raises the question of what value would in practice be obtained for the indent diameter, d, given that there is not a well-defined “rim” to the“crater”. In Fig.2, an attempt has been made to identify the locations that would probably be perceived as the “edges” of the indents.
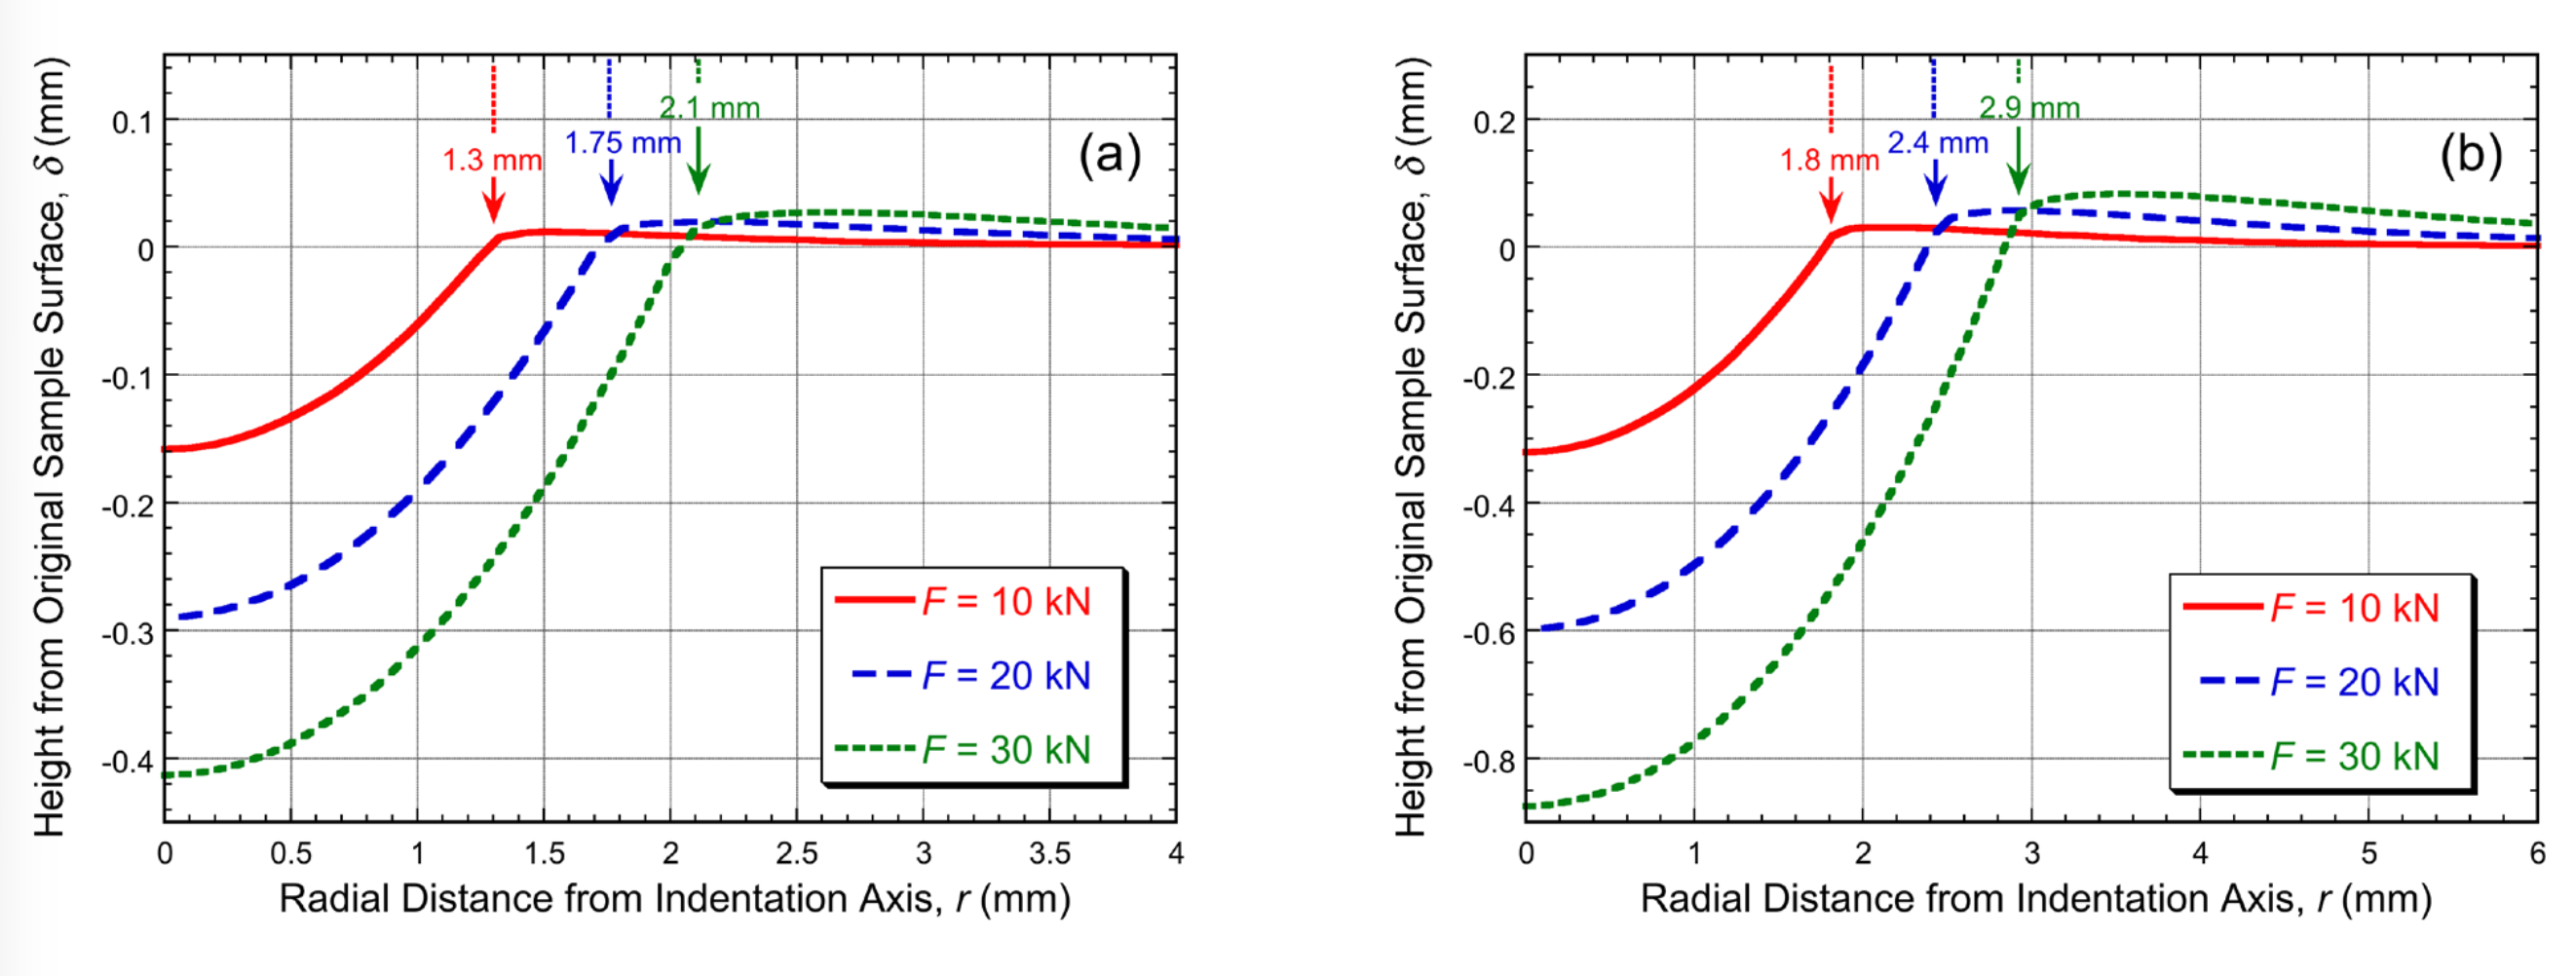
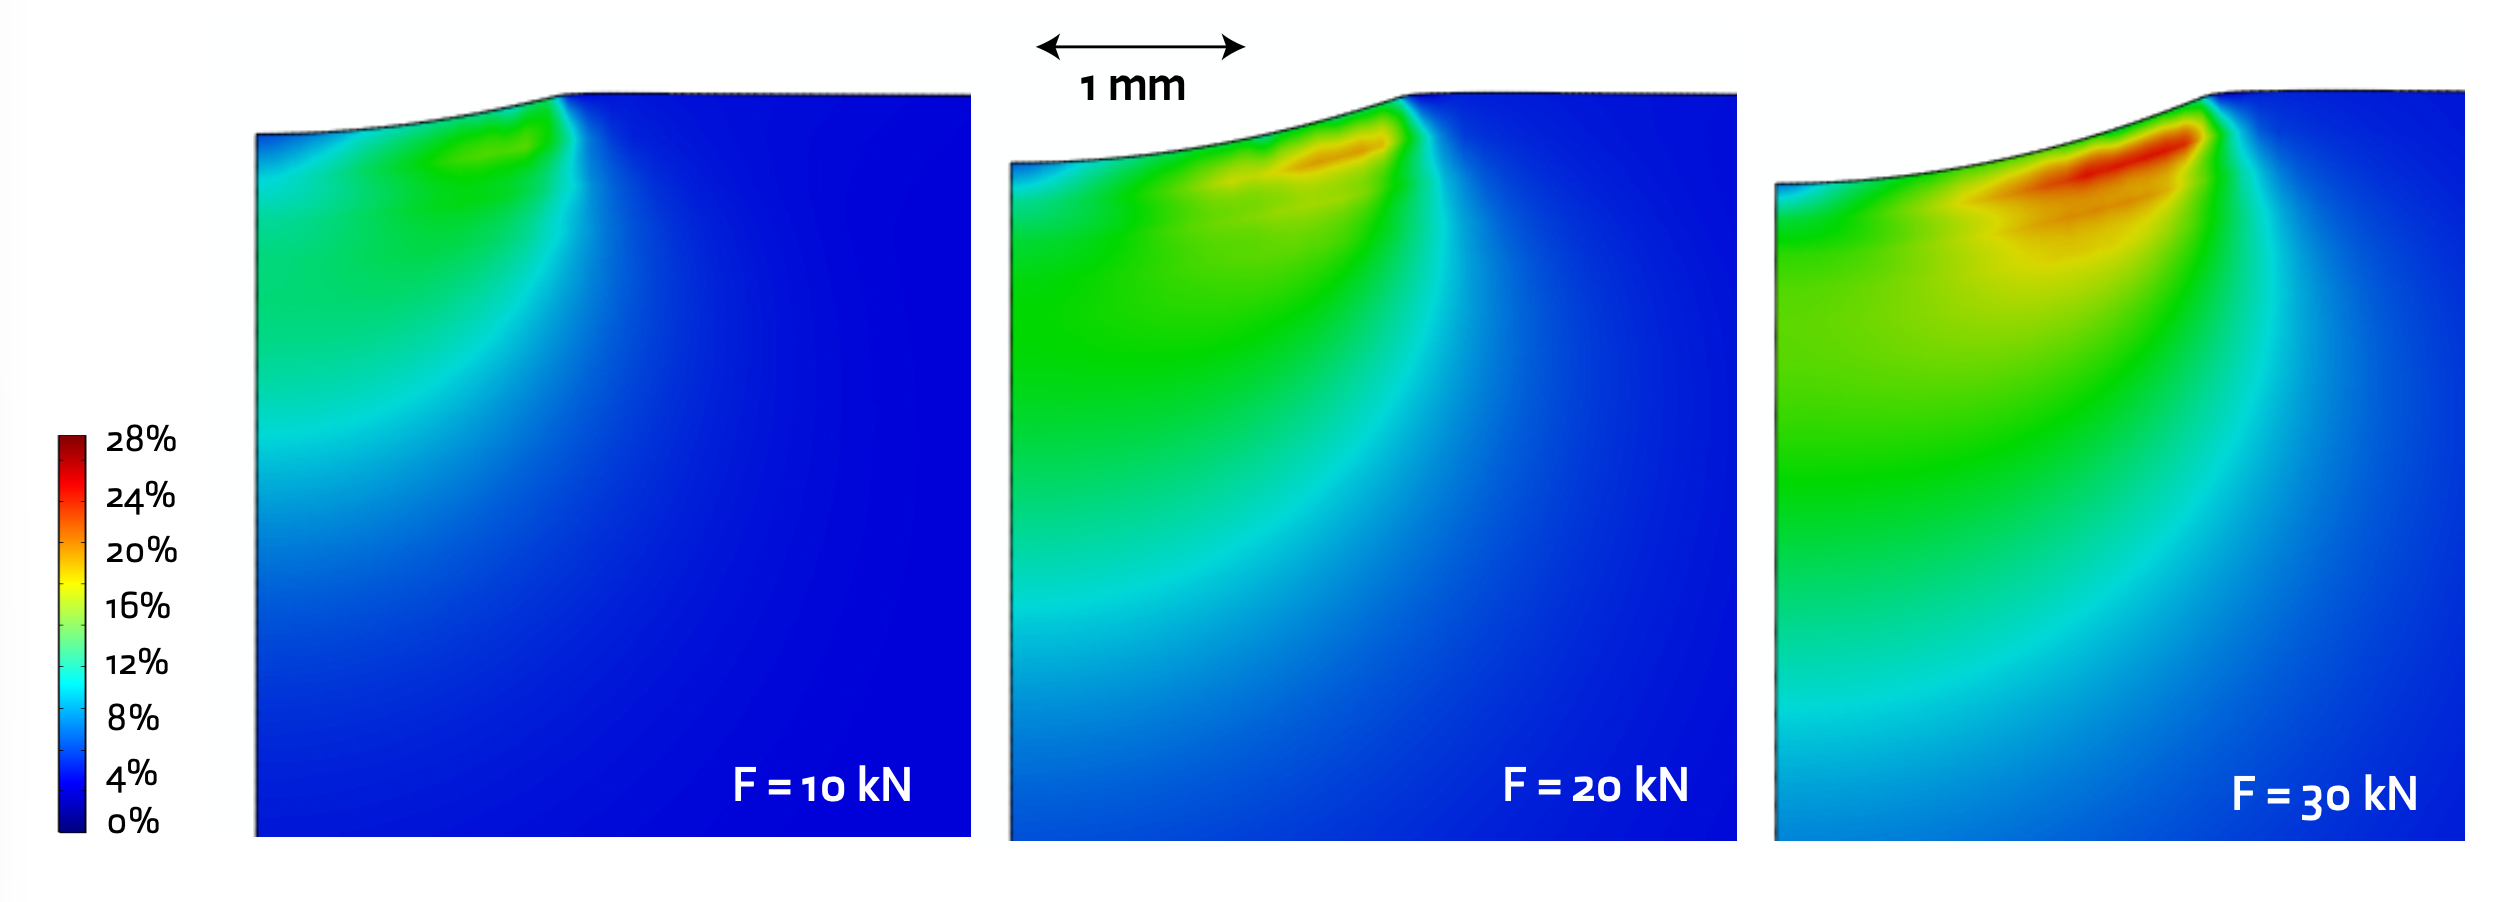
If the values shown are used in Eqn.(1), then, for the Mangalloy, the HB numbers obtained would be 189, 205 and 210, for loads of 10, 20 and 30 kN respectively. For the duplex stainless, corresponding HB values are 97, 106 and 105. In fact, there is always likely to be uncertainty about the measured diameter, with sensitivities such that the associated error in hardness number could be relatively large. For example, if the measured radius for the largest Mangalloy indent had been recorded as 2.0 mm, rather than2.1 mm, then HB would be raised from 210 to 230. Nevertheless, there is an explanation for the observed rises in HB with increasing load. This leads to higher plastic strains, as can be seen in the strain fields shown in Fig.3.Depending on the work–hardening rate, this causes the effective “flow stress”to rise.
2.2 The Rockwell Test
Issues with hardness set-ups include a potential influence of the surface roughness of the sample and the possibility of the mechanical “backlash” of the machine affecting the outcome.
These led to the idea of a multi-stage test –ie to a preloading of some sort, before the test proper was carried out. This was exploited in 1914 by the Rockwell brothers (Hugh and Stanley). Two types of indenter are used in Rockwell testing. One is a diamond cone with a 120˚included angle. There is always an issue with such geometries concerning the exact shape at the tip. This is taken to be spherical (and indeed there must always be a finite radius at the tip of any such indenter), but the radius of the tip region is not defined. The other type of indenter used is a (hard) steel sphere of diameter 1.588 mm (1/16 inch), which at least has a well-defined geometry. The diamond cone is used for hard materials, such as tungsten carbide (Rockwell scale A) and relatively hard steels (Rockwell scaleC). The steel sphere is used for softer materials, such as Al, Cu, brass and less hard steels (Rockwell scale B).
The procedure involves applying a pre-load(“minor load”) – normally 10 kgf (98.1 N). The depth of the resulting indent will, of course, vary with the hardness of the material, but it is usually at least several tens of microns, so that it penetrates the region of surface roughness, oxide films etc, at least in most cases. The penetration measurement device, which is usually some kind of dial gauge, is set to zero. The main load is then applied. This is an additional 140 kgf for Rockwell C, 90 kgf for RockwellB and 50 kgf for Rockwell A. (This latter value is smaller, despite tungsten carbide being in the hardest category, mainly to reduce the danger of damaging the diamond tip.) This main load is usually applied for a specified time, or possibly until the dial gauge “stops moving”. The main load is then removed.The penetration distance, δ, used to obtain the hardness number, is the difference between this depth (with minor load still applied) and the depth when the minor load was applied originally (at which the dial gauge had been zeroed).
The hardness number for category C is then given by
HRC = 500(0.2 – δ)
where δ is in mm. This is entirely arbitrary.It doesn't represent an attempt to estimate the load over the contact area, which is handicapped by uncertainty about the exact geometry of the tip of the diamond indenter. In practice, it's just an empirical correlation. Of course, it could be argued that, since any hardness number has little or no intrinsic meaning, any number will do: it will at least be larger for cases in which the indenter penetration is lower (and the material is harder). It can be seen that an “infinitely hard” material (no penetration) will give a value of 100. In practice, the Rockwell C hardness values for a range of (fairly hard) steels run from about 10 up to around 70.
For category B, the equation used is:
HRB = 500(0.26 – δ)
Again, this is arbitrary. In particular, it does not arise from a geometrical construction aimed at equating the hardness number to the load over the contact area (as the Brinell number does). The2-stage loading procedure means that the contact area cannot be simply expressed in terms of δ, even when, as in this case, the sphere diameter is known.
The main attraction of Rockwell testing is that there is no need to measure (optically) an indent diameter. The depth is measured by the machine and converted to a hardness value (displayed directly on the dial gauge). Also, the idea of a 2-stage loading procedure does have advantages in eliminating the effects of surface roughness etc. It is common to see charts allowing conversion between hardness numbers for the different schemes, but these also are simply empirical correlations. It's clear from the rather arbitrary nature of all hardness numbers that such conversions give only guidelines at best.
2.3 The Vickers Test and Berkovich Indenters
The Vickers test was developed in 1924, bySmith and Sandland (at Vickers Ltd.). A key objective was to reduce the load requirements.
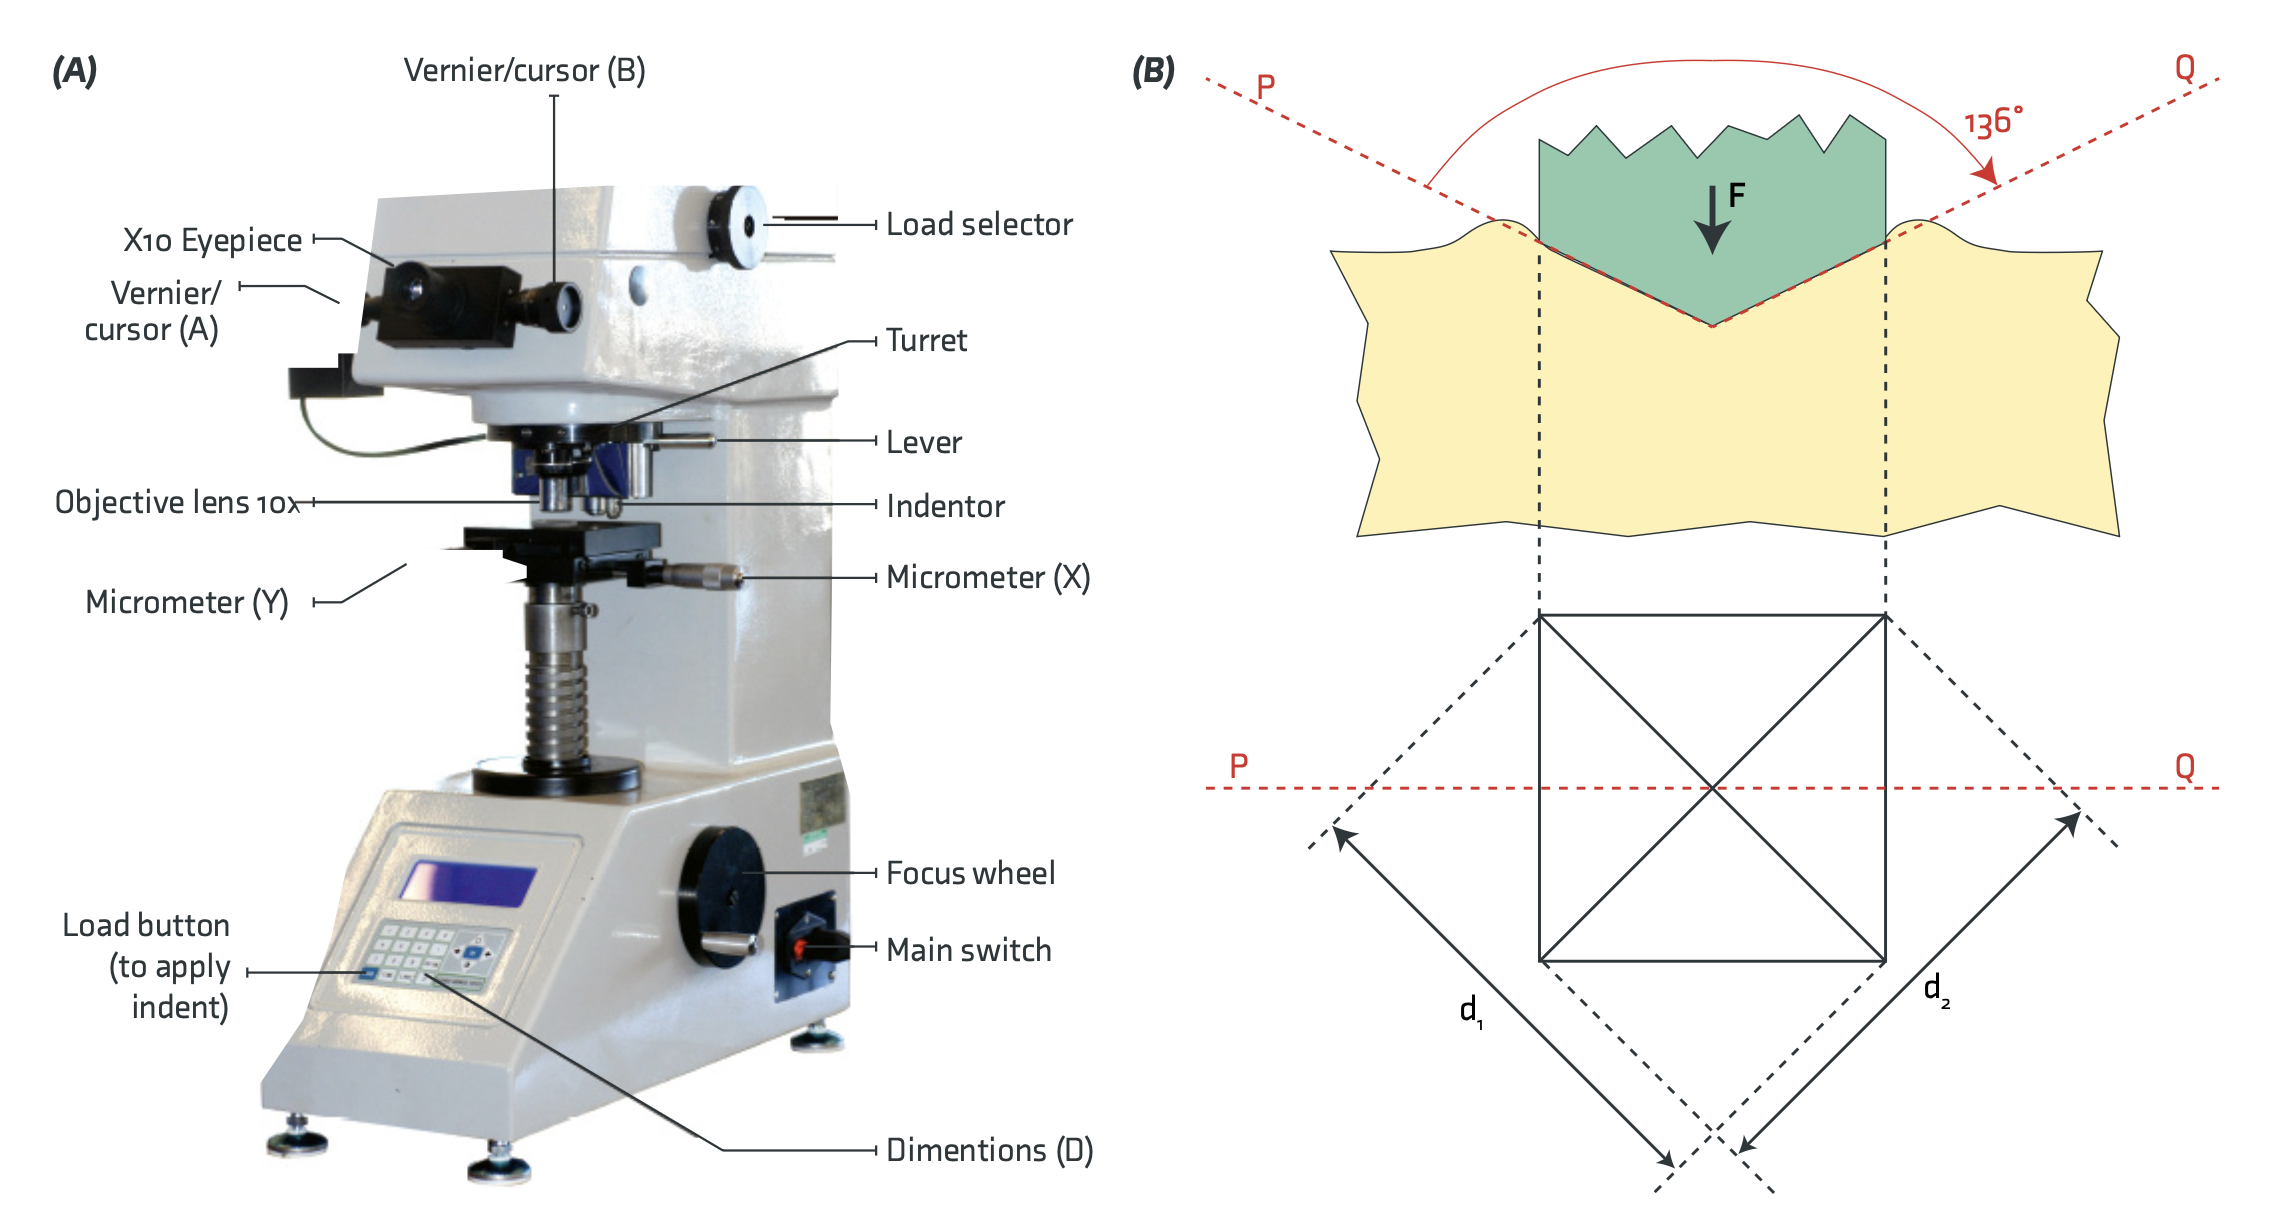
Both the Brinell (3000 kg) and the Rockwell(~100 kg) tests require loads that are too high to be readily supplied via simple dead-weights located inside the machine. Changing the indenter from a relatively large sphere (or conospherical shape) to a smaller and “sharper”shape allowed a lower load (that could be created with a dead-weight) to be used. Several such weights are usually provided inside the machine, ranging from below 1 kg up to around 50 kg, depending on the model. The (diamond)indenter is a right pyramid with a square base and an angle of 136˚ between opposite faces. The (sharp) edges promote penetration and the lines that they produce in the indent facilitate measurement of its size.
A photo of a typical Vickers testing machine is shown in Fig.4(A) and the geometry of the indenter and indent is illustrated in Fig.4(B). The measured indent diameter, d, taken as the average of d1 and d2, is measured in projection (as for the Brinell test). The value of HV (load divided by contact area) is given by:
HV = 2F sin(136/2) / d² ≈ 1.854 F / d²
A simple calculation, similar to that for theBrinell test (Eqn.(1)), thus allows the hardness number to be obtained from the measured value of d. As with the Brinell test, elastic recovery of the specimen, and “pile-up” or “sink-in” around the indent, are neglected.
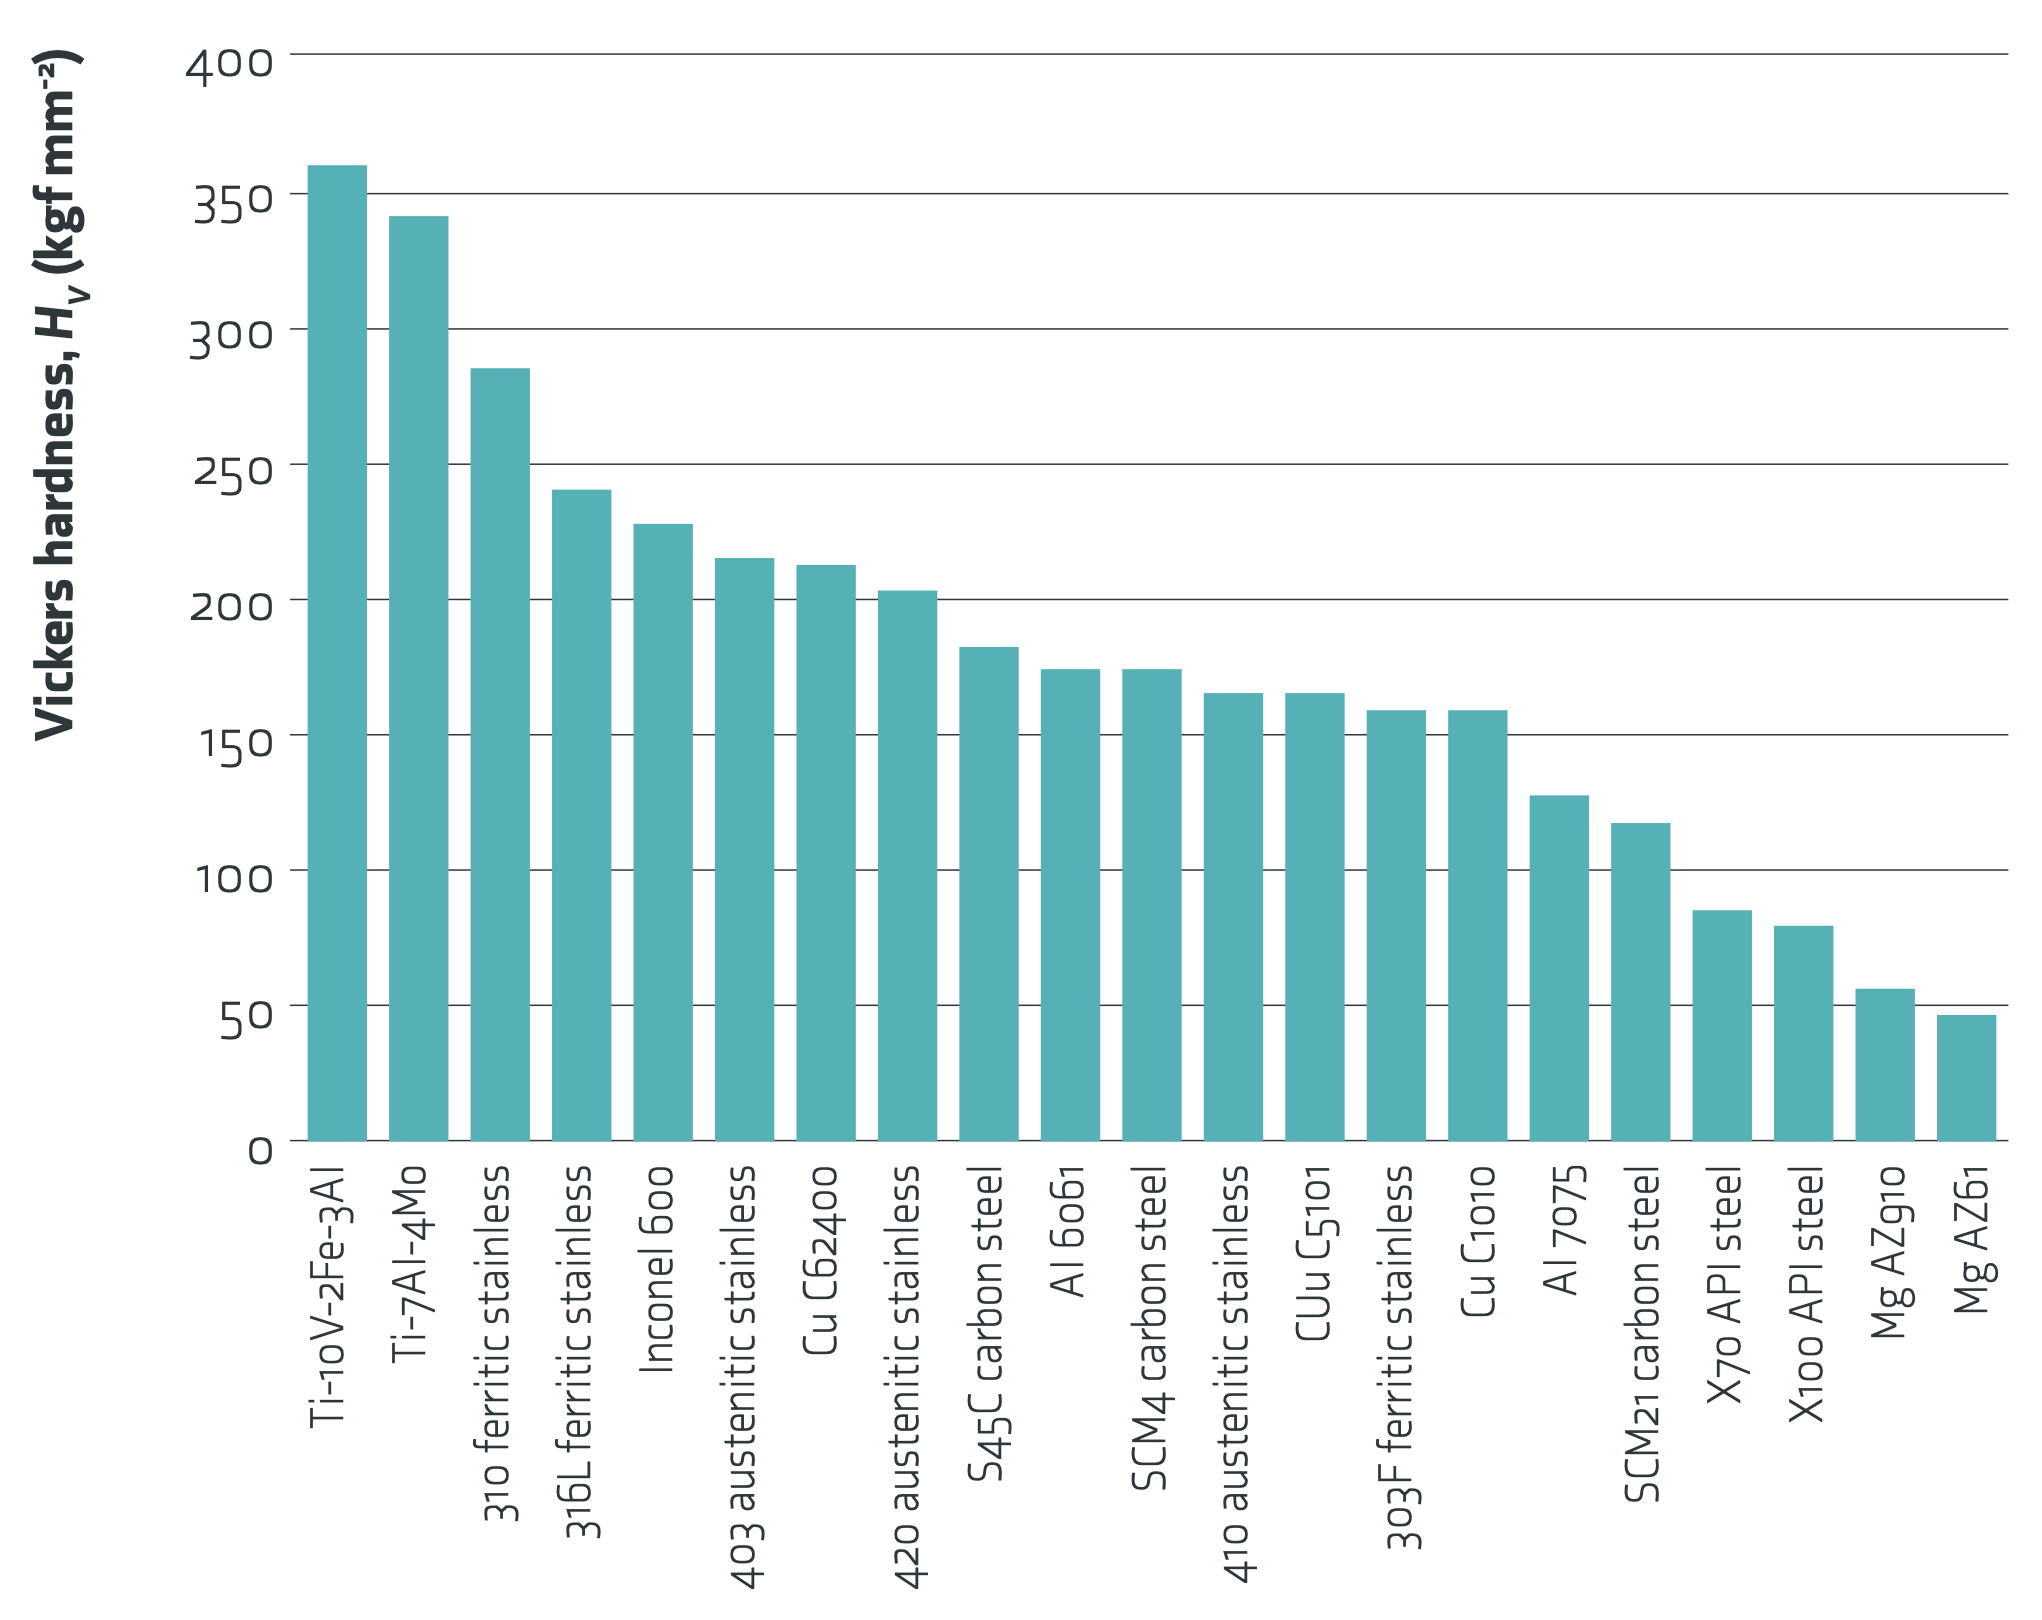
The Vickers test is widely used. In fact, HV is the most commonly-quoted of the hardness numbers, partly because, by varying the load, it can be applied to a wide range of metals, and to thin sections, surface layers etc. Also, the equipment required is cheap and simple. Fig.5shows a typical set of values [9], covering various alloys. These were obtained via a careful set of measurements on indent dimensions in particular samples.These data do serve to illustrate typical ranges, although the exact numerical values should, to say the least, be treated cautiously.
The stress acting on the contact area (in MPa) is obtained on multiplying this hardness number by g (9.81). This stress bears no simple relation to the stress-strain curve. However, if work hardening is neglected, then the hardness should be proportional to the yield stress (ie the“flow stress”). For the Vickers test, the relationship is often written as
σY ≈ HV / 3
Such expressions are commonly used to obtain a yield stress from a hardness measurement and the basis for this kind of estimate should be understood. It is based on the broad nature of the stress and strain fields expected under a Vickers indenter, in the absence of work hardening.
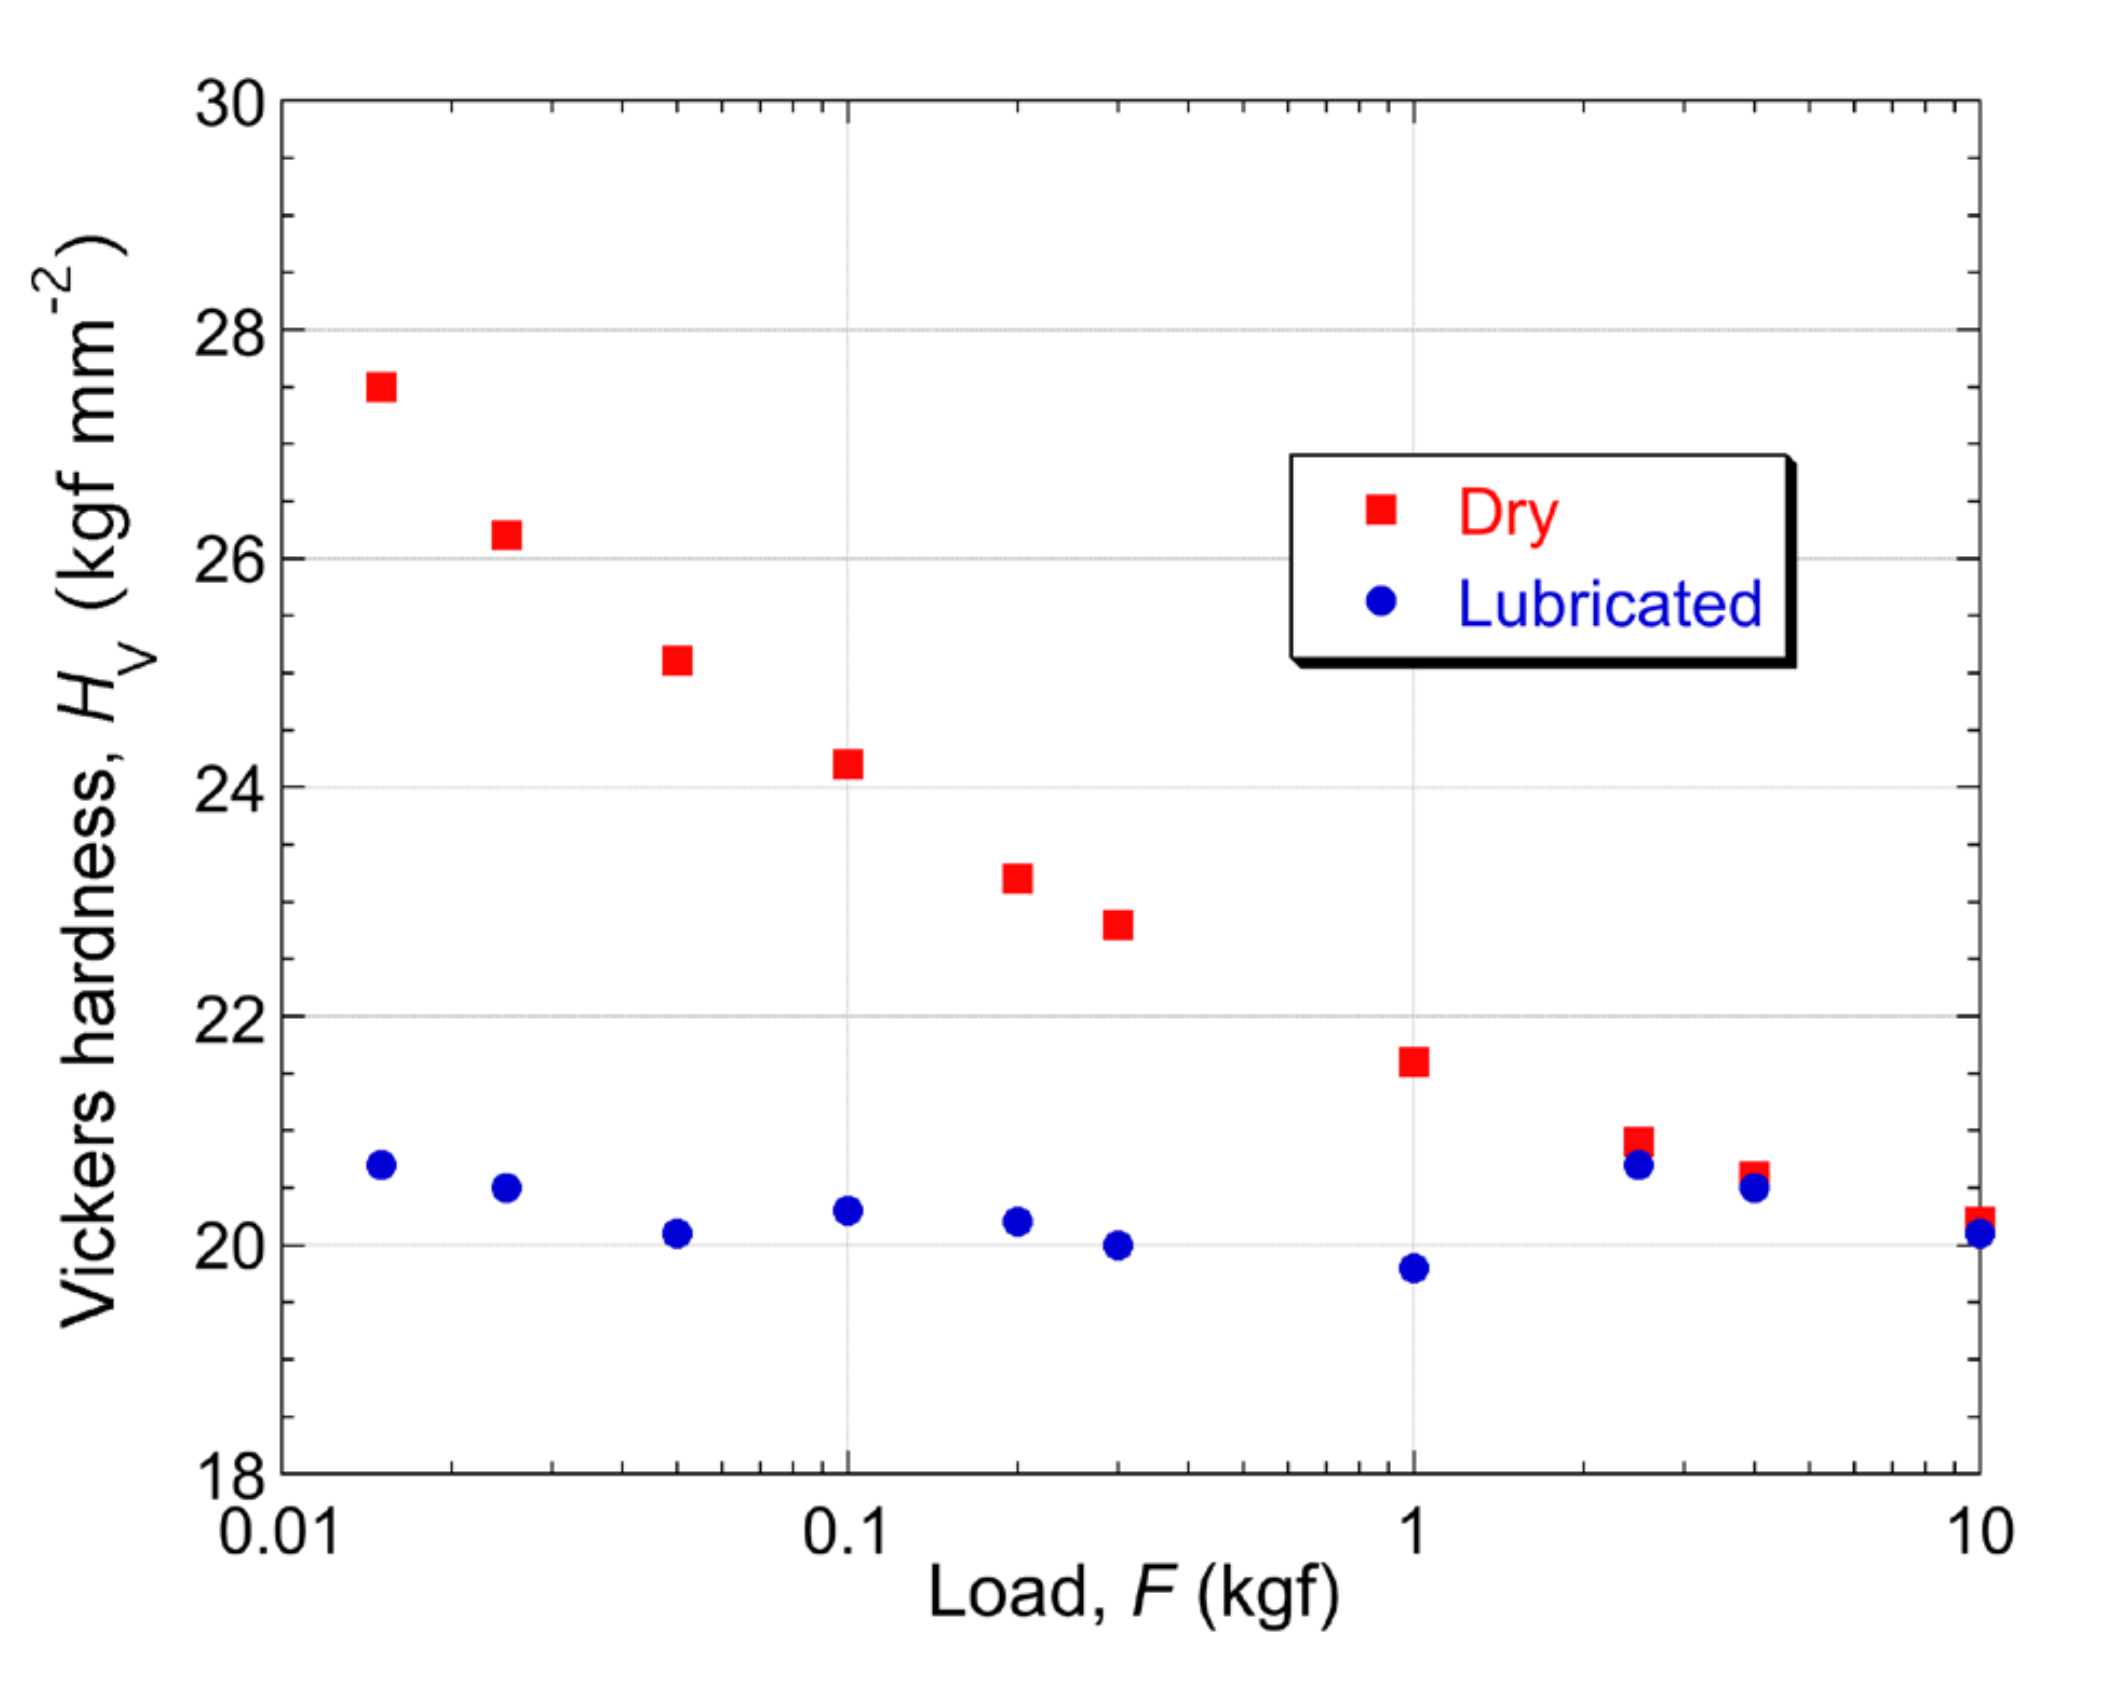
There is also another concern about theVickers test, which does not apply to the same extent for Brinell and Rockwell tests. Taking the example of a 10 kg load and a sample having an HV value of200 (a typical medium strength steel or a Ti alloy), use of Eqn.(4) indicates that the diameter of the indent is about 0.15 mm (150 µm). The corresponding depth is about 20 µm. This size range is rather similar to that of many grain structures and the possibility starts to arise of the indent being located within a single grain, or perhaps a small group of grains. If bulk properties are required, then the assembly of grains being mechanically deformed must be relatively large. Of course, a larger load can be used for harder materials, in an attempt to ensure that the deformed volume is sufficiently large to be“representative”, although with many Vickers machines the maximum load is 10kg. This effect is often manifested during testing as a large degree of scatter between repeat tests in different locations, although it is important to appreciate that the “correct” mechanical response is not simply the average of those from a number of (differently oriented) individual grains.
This is illustrated by the data in the plot[10] of Fig.6, which shows values of HV (for the same material) over a range of applied loads, with and without lubrication. The effect of lubrication apparent in Fig.6 suggests that surface-related phenomena are playing an important role for fine indents – of course, lubrication is uncommon in normal practice. The material concerned is very soft, but nevertheless the penetration created by loads of 10–100 g (0.1 - 1 N) is only of the order of a few microns: the effects of surface roughness, contamination and oxide films are expected to be very strong in this regime.
Finally, a point can be made that applies to virtually all “sharp” indenters, which relates to the danger of them becoming damaged in some way. “Edges” and “points” are always prone to such damage, since the stresses created at them, and also the plastic strains in the material in contact with them, tend to be relatively high. These also tend to be regions where oxidative attack is more concentrated, which is a factor to bear in mind with diamond indenters (if used at high temperature). Of course, any such damage is likely to affect the hardness readings obtained using that indenter.
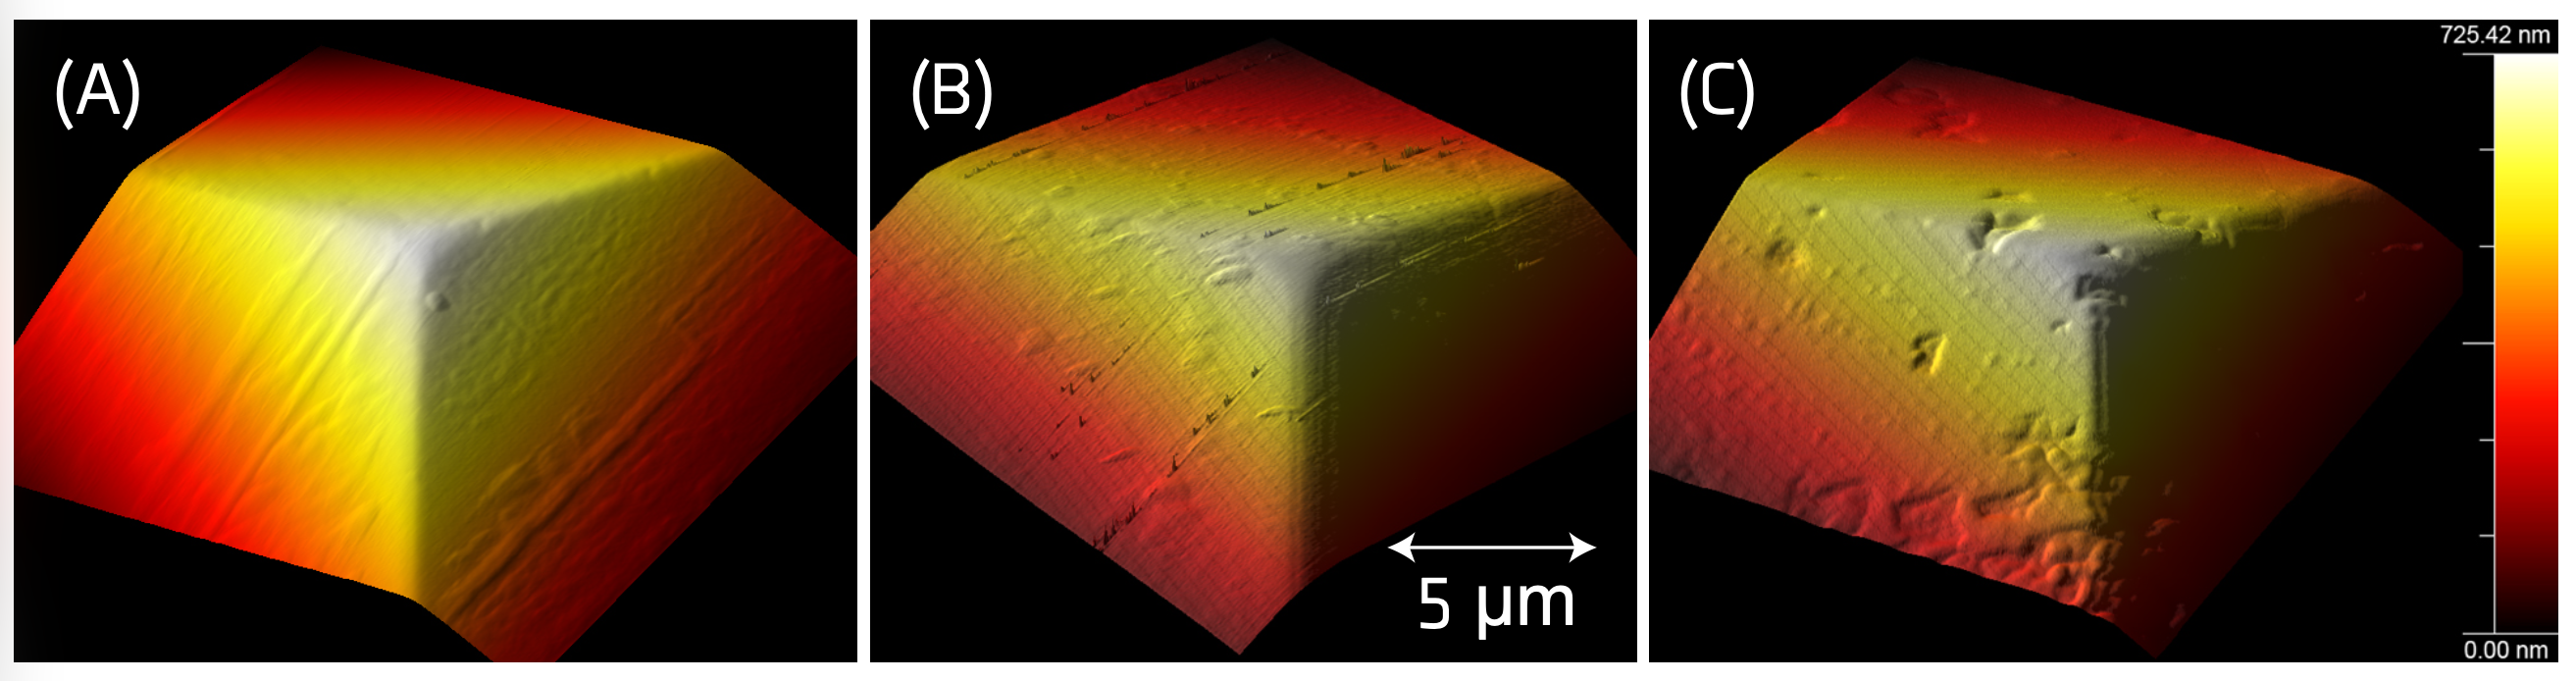
As an illustration of the type of damage that can occur, three AFM images [11] are shown in Fig.7. These are of Berkovich tips exposed to different service conditions. Berkovich tips are similar toVickers tips, but based on a 3-sided pyramid, rather than a 4- sided one. (The main motivation for using a Berkovich, rather than a Vickers, is actually that it is much easier to produce: grinding a diamond to create a single sharp point is easier for a 3-sided pyramid than for a 4-sided one.) It can be seen from these images that such diamond tips can become damaged, particularly if exposed to high temperature in the presence of oxygen. The oxidation rate is sensitive to both temperature and oxygen partial pressure [11], although loss of sharpness at the edges can be seen even with the tip (Fig.7(A)) that had not been heated substantially, but had been in use for an extended period.Spherical indenters are much less susceptible to damage during use.
2.4 The Knoop Test
The most recent of the “standard” set of hardness tests is that of Knoop, which was proposed [12] by Frederick Knoop in1939. The shape of the indenter is similar to that of Vickers – ie it is a4-sided pyramid – but the length of the long diagonal is about 7 times that of the short diagonal.
This unusual shape is designed to create relatively shallow penetration (while still having a lateral dimension that is relatively large and hence easy to measure). The Knoop hardness number is given by:
6. HK ≈ F / CL²
where L is the measured length (in projection)of the long diagonal and C is a factor related to the indenter shape. In principle – ie from the actual geometry of the indenter, it has a value of about 0.07. Values of HK are typically in the range 100–1000. It is often used for relatively hard materials (including ceramics) and for thin layers, surface coatings etc. Loads applied during Knoop testing are often relatively low(<1 N) and indents are very shallow. This immediately raises the issue of surface roughness / contamination effects and surfaces often need careful preparation. Also, even the long diameter is commonly very short and difficult to measure accurately (via optical microscopy). Furthermore, very low loads of this type are difficult to apply using the “traditional” methods of hardness testing (dead-weights and hydraulic systems).
Microstructure, Anisotropy and Indentation of Single Crystals
There are complicating factors when creating indents within individual grains, or when indenting a single crystal.
The latter is in some ways an easier situation to treat than the former, since it will in general be easier to establish the orientation of a single crystal than an individual grain within a polycrystal. In addition, with a single crystal there need be no concern about the possibility that the indent could be straddling a grain boundary, or deforming a small number of grains – a difficult scenario to interpret in a systematic way.
Fig.8 (on the following page) shows optical micrographs of the free surfaces of samples after indentation with a spherical indenter of radius 1 mm. The sample of Fig.8(A) is a single crystal, whileFig.8(B) is from a typical polycrystalline specimen (at higher magnification).A number of important differences are clearly apparent, although it may be noted that both show a number of “surface steps”. These are persistent slip bands – intersections of the free surface with slip planes along which large numbers of dislocations have glided. For the single crystal, which was oriented with a <100> direction normal to the free surface, the slip occurred on a well-defined set of planes (of {111} type). One consequence of this is that the indent does not exhibit radial symmetry. Put another way, the material is plastically (and elastically) anisotropic. It would be possible to analyse this situation, and perhaps obtain information about this particular crystal (such as the critical shear stress for dislocation glide), but it would need to be done with a knowledge of the crystal orientation and with account taken of which slip systems were operational. A single hardness value could not be obtained (since it varies with direction in the crystal).
.png)
With the indent of Fig.8(B), on the other hand, it is relatively easy to obtain information about (bulk) plasticity characteristics, despite what actually happens during indentation being much more complex than for the single crystal. A large assembly of grains was deformed during indentation, so the response is representative of the bulk (the behaviour of which depends on grain size, texture, grain boundary structure etc, as well as on intra- granular features such as purity, alloy composition, precipitate size and dispersion etc). It can be seen that multi-system slip occurred in most of the grains, as it does during tensile testing. Furthermore, at least in most cases, the response is isotropic, so the indent exhibits radial symmetry and a similar outcome (indent profile) is obtained if the material is indented in a different direction – indentation involves multi-axial interrogation of the mechanical response. In fact, it's possible, not only to obtain a single hardness number, but also to infer the stress-strain curve of the material (via Indentation Plastometry).
References:
1. Broitman, E, Indentation HardnessMeasurements at Macro-, Micro-, and Nanoscale: A Critical Overview. TribologyLetters, 2017. 65(1).
2. Bishop, RF and NF Mott, The Theory ofIndentation and Hardness Tests. Proceedings of the Physical Society of London,1945. 57(321): p. 147–159.
3. Tabor, D, Hardness of Metals. 1951, Oxford:Clarendon Press.
4. Mott, BW, Microindentation HardnessTesting. 1956, London: Butterworths.
5. Herrmann, K, NM Jennett, W Wegener, JMeneve, K Hasche, and R Seemann, Progress in Determination of the Area Functionof Indenters Used for Nanoindentation. Thin Solid Films, 2000. 377: p. 394–400.
6. Richmond, O, HL Morrison, and ML Devenpeck,Sphere Indentation with Application to Brinell Hardness Test. InternationalJournal of Mechanical Sciences, 1974. 16(1): p. 75–82.
7. Hill, R, B Storakers, and AB Zdunek, ATheoretical Study of the Brinell Hardness Test. Proceedings of the RoyalSociety of London Series a-Mathematical Physical and Engineering Sciences,1989. 423(1865): p. 301–330.
8. Biwa, S and B Storakers, An Analysis ofFully Plastic Brinell Indentation. Journal of the Mechanics and Physics ofSolids, 1995. 43(8): p. 1303–1333.
9. Kang, SK, JY Kim, CP Park, HU Kim, and DKwon, Conventional Vickers and True Instrumented Indentation HardnessDetermined by Instrumented Indentation Tests. Journal of Materials Research,2010. 25(2): p. 337–343.
10. Atkinson, M, Further Analysis of the SizeEffect in Indentation Hardness Tests of Some Metals. Journal of MaterialsResearch, 1995. 10(11): p. 2908–2915.
11. Wheeler, JM, RA Oliver, and TW Clyne, AfmObservation of Diamond Indenters after Oxidation at Elevated Temperatures.Diamond & Related Materials, 2010. 19: p. 1348–1353.
12. Haddow, JB, A Study of Knoop HardnessTest. Journal of Basic Engineering, 1966. 88(3): p. 682.
Frequently Asked Questions
What is hardness?
Hardness is a measure of the resistance that a material offers to plastic deformation. A specified load is applied to an indenter, which penetrates the specimen and leaves a permanent depression. The hardness number is usually obtained from the lateral size of that indent or from the penetration depth.
Why do different hardness tests give different numbers for the same material?
Plastic strains during indentation depend on indenter shape and applied load, as well as on the plasticity characteristics of the material. Since the load affects the hardness number, it should always be quoted alongside the value, although it often is not.
Is hardness a well-defined material property?
No. Identical hardness numbers can be obtained from materials exhibiting a wide range of yielding and work hardening characteristics. Hardness numbers should be regarded as no better than semi-quantitative, and procedures that accord them higher significance rest on an unsound approach.
What is the Brinell test?
Developed in 1900, it involves pushing a 10 mm diameter hard sphere into the sample using a 3000 kg (~30 kN) load. It is oriented towards steels and is not suitable for much softer metals. The large ball interrogates a relatively large volume containing many grains, which is an advantage for heterogeneous materials, though the resulting indent means the test cannot really be described as non-destructive.
What is the Rockwell test?
Exploited in 1914 by the Rockwell brothers, it uses a two-stage loading procedure with a minor pre-load followed by a main load, which helps eliminate the effects of surface roughness and machine backlash. Depth is measured by the machine and converted to a hardness value, removing the need for optical measurement of an indent diameter. The equations behind Rockwell C and B numbers are empirical correlations rather than geometrical constructions.
What is the Vickers test?
Developed in 1924 by Smith and Sandland at Vickers Ltd., it uses a diamond right pyramid with a square base and an angle of 136˚ between opposite faces, allowing much lower loads supplied by dead-weights. HV is the most commonly quoted hardness number, partly because varying the load allows it to cover a wide range of metals, thin sections and surface layers.
What is the Knoop test?
Proposed by Frederick Knoop in 1939, it uses a four-sided pyramid whose long diagonal is about seven times the short one, producing shallow penetration with a lateral dimension large enough to measure. It is often applied to hard materials including ceramics, and to thin layers and surface coatings. Loads are often below 1 N, so surface roughness and contamination become significant and surfaces frequently need careful preparation.
Can hardness numbers be converted between scales?
Conversion charts between the different schemes exist, but they are simply empirical correlations. Given the arbitrary nature of all hardness numbers, such conversions give only guidelines at best.
Can yield stress be calculated from a hardness number?
Expressions such as σY ≈ HV/3 are commonly used, and they rest on the broad nature of the stress and strain fields expected under a Vickers indenter in the absence of work hardening. Materials that exhibit no work hardening at all are rare, so the basis for this kind of estimate needs to be understood before the result is relied upon.
Why does indent size matter relative to grain size?
For a 10 kg load and an HV of 200, the indent diameter is around 0.15 mm with a depth of about 20 µm, which is comparable to many grain structures. The indent may then sit within a single grain or a small group of grains, which shows up as large scatter between repeat tests in different locations.
Can a stress-strain curve be obtained from an indent?
Yes. Where a large assembly of grains is deformed, the response is representative of the bulk and it becomes possible to infer the stress-strain curve of the material via indentation plastometry. The technique uses an indenter around 1 mm in diameter, large enough to reflect bulk plasticity in most cases while creating indents small enough to be regarded as non-destructive.

James is a co-founder of Plastometrex and aleading authority on indentation testing and finite element analysis. He holdsa PhD from the University of Cambridge, where he spent 15 years working on themechanics of materials, including the development of methods and models formeasuring mechanical properties from indentation data. He has published over 30peer-reviewed papers and delivered invited talks and plenary lectures on thesubject at international conferences.