Metal AM builds often rest on parameter sets chosen from an enormous field of options. A common first step is to measure density using small 1cm3 samples, but when strength matters for the final build, those initial measurements can’t give engineers what they need for informed design decisions.
By Dr Henry Begg, Applications Engineering Manager, Plastometrex
The foundation of every additively manufactured (AM) build is a parameter set.Laser power, spot size, scan speed, hatch spacing, and layer thickness are all independently adjustable, and a multi-factorial experiment design may use any number of them to establish a viable process window [1]. Each independent parameter governs the thermal history the metal experiences during production. This not only influences porosity, but it also impacts the microstructure and resultant mechanical properties of the material.
The combinations are mind-bogglingly endless. One 2026 paper describing an AI-guided approach to this problem estimated more than 100 million possible configurations for one directed energy deposition (DED) process [2].
When every part qualification costs material, machine time, and engineering attention, it’s no wonder that an initial mechanical property screening step for potential alloys isn’t the standard.
Density as the first barrier
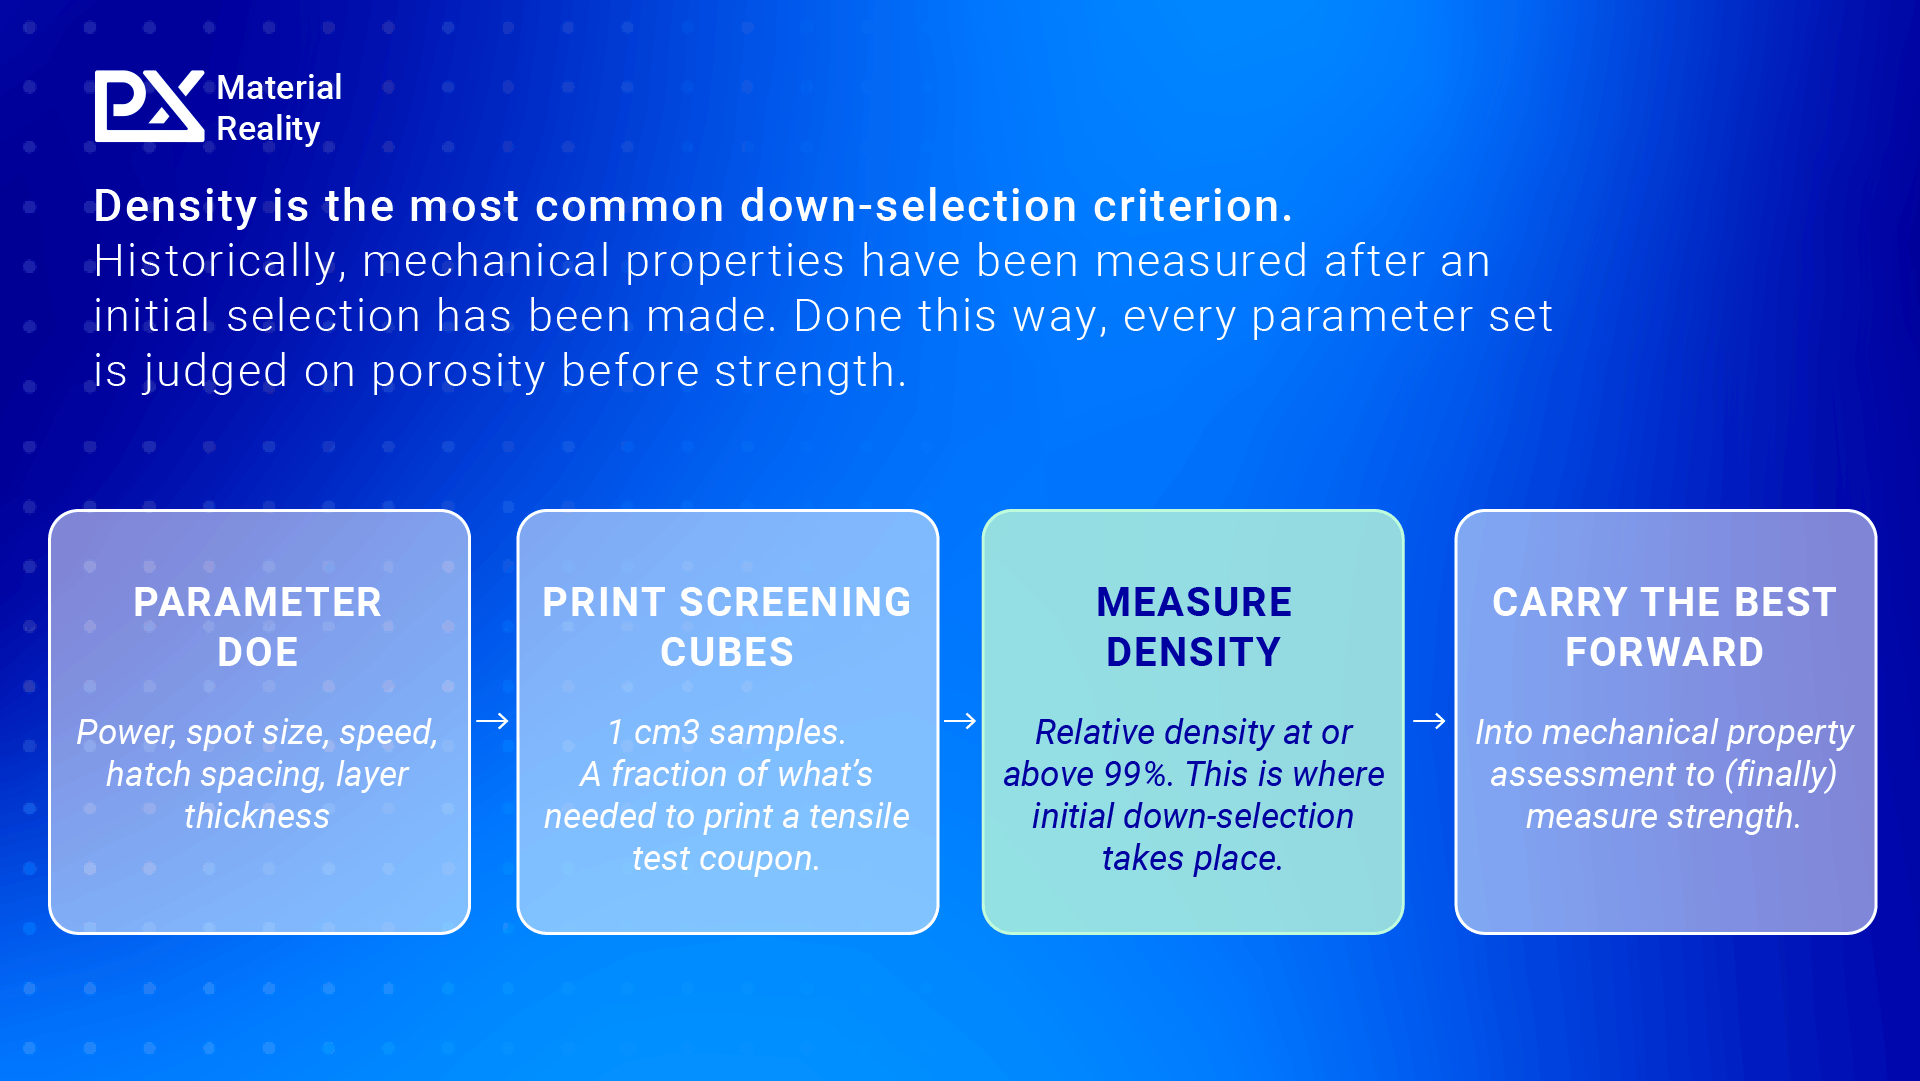
Density is often used as the down-selection criterion on parameter Design of Experiment (DOE) approaches. Iterative testing is used to establish process windows, which ideally will result in fully dense samples, with relative density at or above99% given as a typical threshold [1], [4]. These parameter sets with the highest densities are assumed to represent the best candidates, so they move onto the next stage of parameter optimisation. In laymen’s terms, engineers print a set of small cubes, measure the density of each, and then carry the best of the bunch forward into mechanical property assessment.
The reason for this methodology is simple. Empirical testing in metal AM is expensive. Powder can run to several hundred dollars per pound, builds are slow, only a few parts can be made at a time, and destructive mechanical testing adds time and cost on top of that [5]. For every tensile test coupon needed to gather mechanical properties, roughly 30 times the material volume of a 1 cm³ screening cube is needed [6]. This material use adds up quickly.
As a result, measuring mechanical properties at the screening stage isn’t a realistic option for most teams. Density can quickly and easily be measured, so density became that initial screening criterion. However, this approach risks missing important trends between parameter and material properties. And, most strikingly, density does not guarantee performance.
Why density and strength come apart
Density describes voids. The metal between those voids (otherwise known as pores) is shaped by its thermal history, and both the pores and that thermal history are set by the same printing parameters.
Changing printing parameters such as power, speed, hatch spacing, or layer thickness will impact the size and shape of the melt pool, as well as the way heat moves through the part. It’s tempting to reduce parameter sets to a single volumetric energy density figure, but that’s worth resisting. Energy density collapses several independently adjustable parameters into one number, and the same nominal energy input reached by different combinations can behave differently.
Porosity and microstructure don’t necessarily respond to parameter changes in the same way. Once conditions have been tailored to avoid either lack of fusion or keyhole defects, there can still be significant differences in microstructures. Two parameter sets can close the pores equally well and still produce different metal.
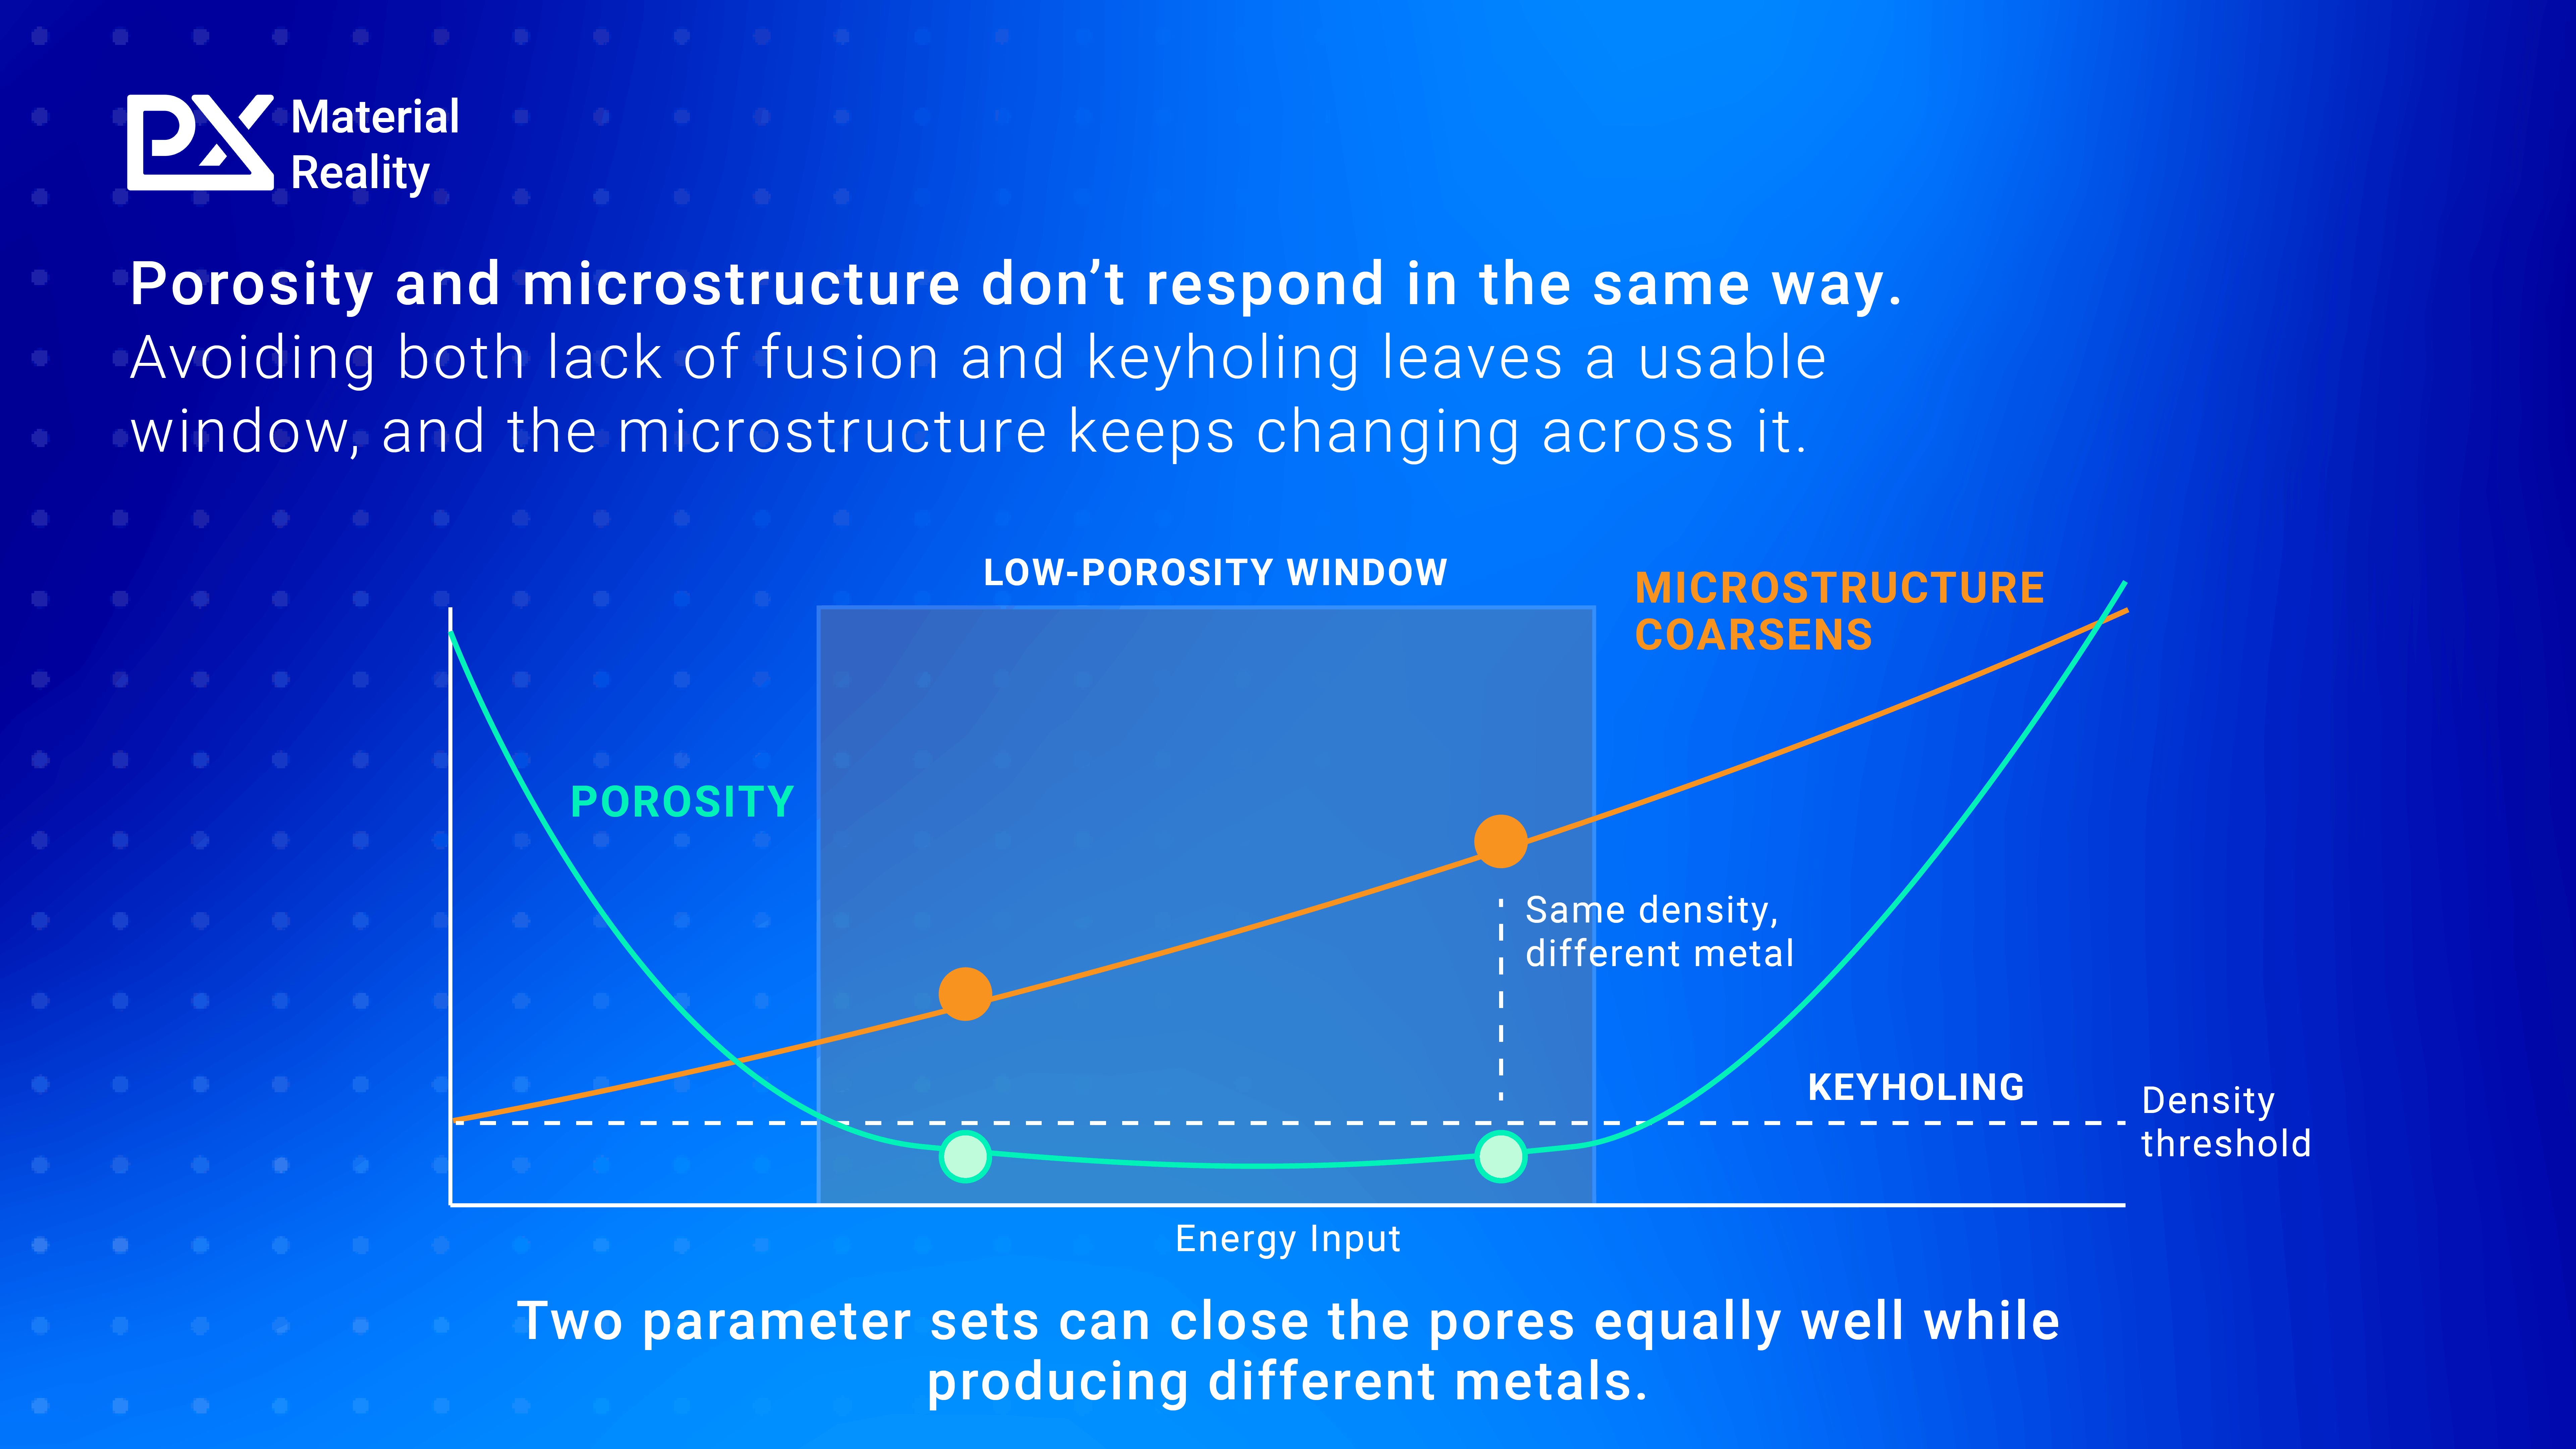
Strength isn’t the only thing affected. Samples produced with similar energy density can contain very different pore populations, with real consequences for performance [4]. What this demonstrates is that a single density number does not provide a complete picture or sufficient information to make informed decisions about mechanical properties.
Sixteen parameter sets
A study run with Additive Manufacturing Solutions demonstrates exactly this. Sixteen parameter sets were printed in AlSi10Mg on an SLM Solutions SLM 500, spanning laser powers from 400 to 625 W across two scan speeds and two layer thicknesses [6].
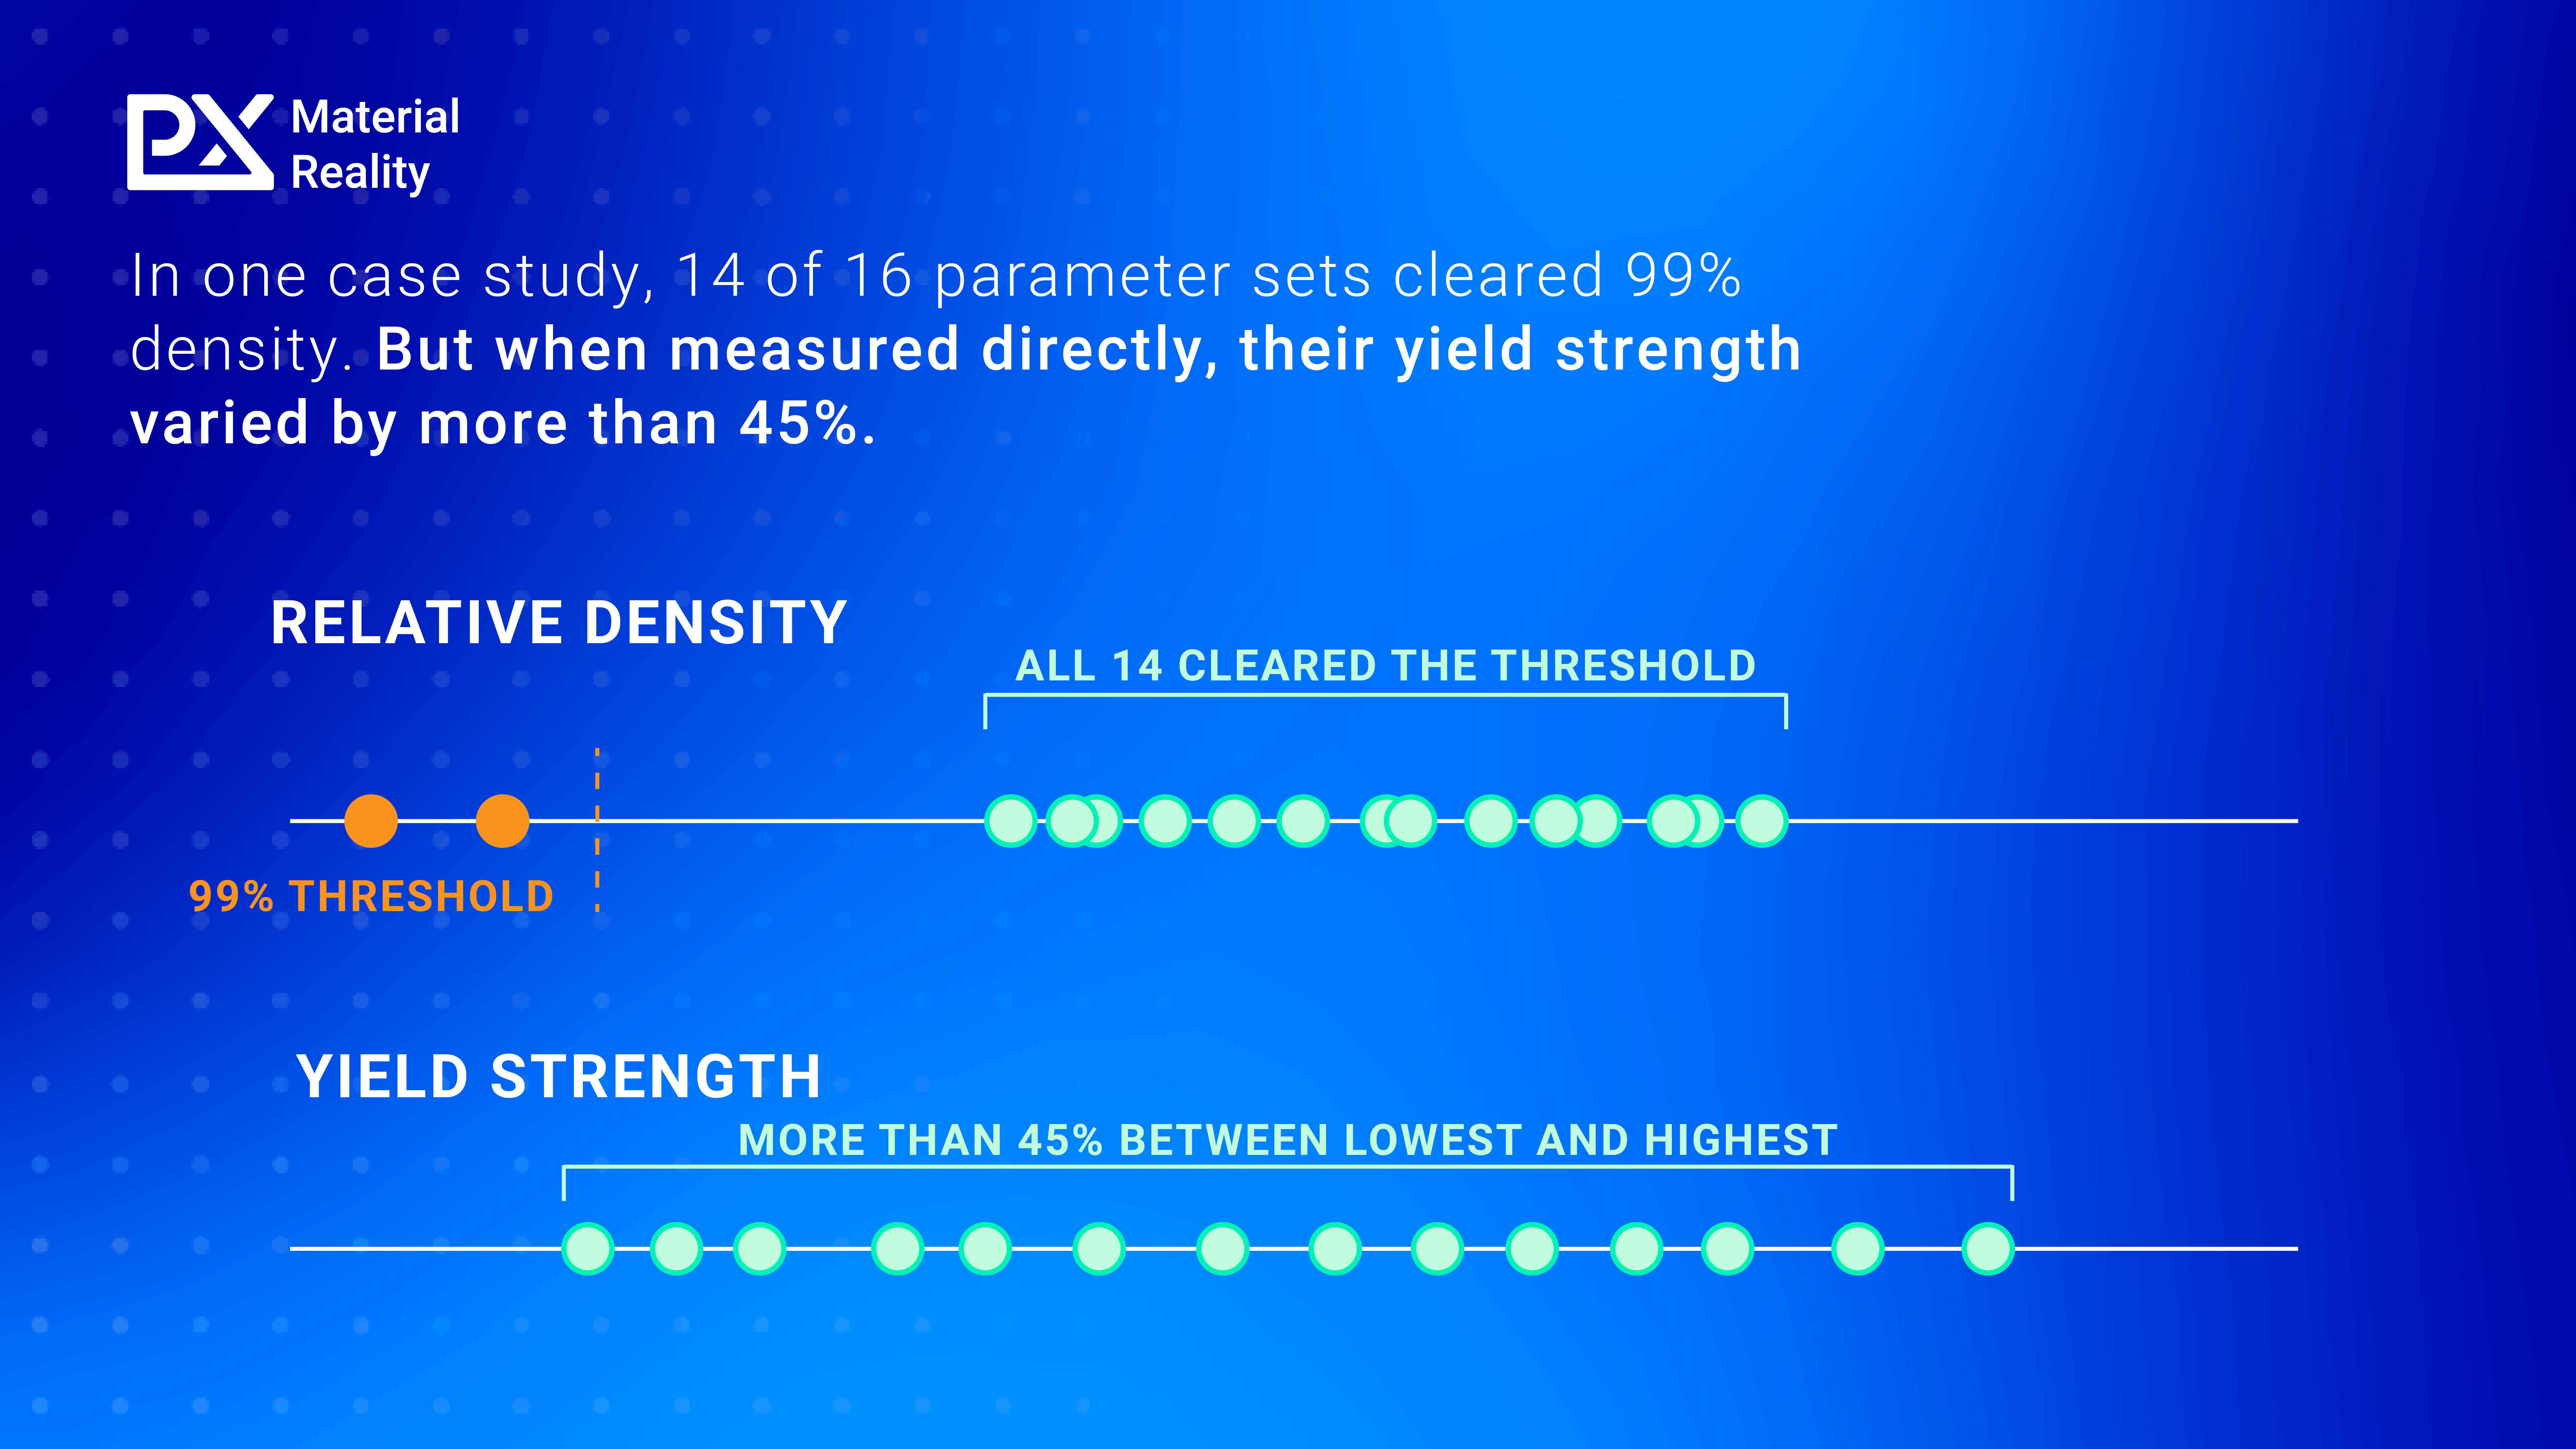
Fourteen of the sixteen cleared 99% relative density. If density was the only thing screened for, all fourteen would be carried forward into mechanical property assessment.
But, when measured directly using PIP (Profilometry-based Indentation Plastometry) , tensile strength across those fourteen varied by almost 20%, and yield strength by more than 45% [6]. That drastic difference in strength between them didn’t show up anywhere in the initial density screening.
What this costs further down the line
It’s possible to pass early checks on density, only to fail mechanical property requirements later on. A parameter set that clears the density check and later falls short of mechanical requirements can send test programmes right back to the beginning, with new parameters, new builds, and new tests. Each cycle can cost upwards of $10,000 [6], adding a substantial barrier to comprehensive parameter set optimisation. This is why qualification, rather than machine capacity, has become a major bottleneck in metal AM: uncertainty about material behaviour is only answered by producing more samples and running more cost and time-intensive process development workflows [7].
There’s another cost that has to be considered. Without reliable mechanical property data at the initial screening stage, some viable parameter sets may be looked over entirely. In the AlSi10Mg study, near-equivalent yield and tensile strength were reachable at both low and high energy density by adjusting layer thickness. This means that engineers can save both time and money by utilising larger layer thicknesses to reduce build time, while achieving equivalent mechanical properties [6].
The consequences scale with the programme. Parameter development is a significant factor in why qualifying a new alloy or a new machine takes as long as it does, and a team that selects on density alone is carrying a risk nobody has quantified. AsAM moves further into safety-critical applications, that unmeasured risk becomes harder to justify, and the screening stage must start answering the questions about strength that the finished part will eventually be judged on.
What would have to change
While tensile testing, microstructural characterisation, and modelling have all been available for decades, they each carry the same cost constraint. If this initial density screening stage is to be replaced by a similarly efficient but more relevant step, mechanical property data must be central. This data would need to come from material already being printed for the density check, without additional builds. And it would need to avoid the thirty-fold material penalty that put tensile testing out of reach in the first place.
Profilometry-based Indentation Plastometry (PIP testing), standardised in ASTM E3499-25, returns stress-strain behaviour from a single indent on samples as small as a nail head[9]. In the study above, it was run directly on the 1 cm³ density cubes that had already been printed for the density check, with minimal surface preparation and no additional material [6].
In that study, running PIP on the cubes that had already been printed cut the cost of the screening campaign by around 95%, and brought the printing time it required down from over 46 hours to 9 [6].
This has a massive impact on the cost and pace of development. Qualification is often the bottleneck in metal AM, and much of what makes it slow is finding mechanical property problems late, after the parameters are fixed and the builds are done. Moving property data to the front of the process means parameter sets can be compared on the properties that matter, build strategies can be optimised for speed with evidence behind them, and far fewer programmes have to start again.
The future of parameter optimisation
Density screening has earned its place. It’s fast, it’s cheap, and for a long time it was the only measurement available at the point the decision had to be made. That constraint shaped the workflow, but this doesn’t have to be the case any longer.
Mechanical property data can be gathered at the same stage, on the same samples, in the same timeframe. The parameter set that makes the strongest part is already sitting in the batch. The only question is whether anyone measures it.
For future updates direct to your inbox, be sure to subscribe to the Material Reality newsletter.
References:
1. A Methodology for the Rapid Qualification of Additively Manufactured MaterialsBased on Pore Defect Structures. https://pmc.ncbi.nlm.nih.gov/articles/PMC10940406/
2. Fadhelet al., Discovery of Feasible 3D Printing Configurations for Metal Alloys viaAI-Driven Adaptive Experimental Design, Proceedings of the AAAI Conference onArtificial Intelligence (2026). https://ojs.aaai.org/index.php/AAAI/article/view/41428
3. How process parameters drive successful metal AM part production, Metal AM. https://www.metal-am.com/articles/70927-2/
4. Improving Laser Powder Bed Fusion IN718 Process Development Efficiency by EliminatingPore Defects of Specified Size. https://www.ncbi.nlm.nih.gov/pmc/articles/PMC12072660/
5. Six-sigma Quality Management of Additive Manufacturing, Proceedings of the IEEE. https://pmc.ncbi.nlm.nih.gov/articles/PMC8269016/
6. Beyond Density: Achieving Optimal AM Parameters with Early Mechanical PropertyTesting, Plastometrex case study with Additive Manufacturing Solutions. https://www.plastometrex.com/resources/case-studies
7. The Next Bottleneck in Metal Additive Manufacturing Isn’t Machine Capacity, It’sQualification, Continuum Powders (June 2026). https://www.continuumpowders.com/the-next-bottleneck-in-metalam-isnt-capacity-its-qualification/
8. Qualification for AM Feedstocks, Machines and Processes, NIST. https://www.nist.gov/programs-projects/qualification-am-feedstocks-machines-and-processes
9. ASTM E3499-25, Standard Test Method for Indentation Plastometry of MetallicMaterials. https://www.astm.org/e3499-25.html
10. The Material Reality, Issue 04. The Conditional Number. https://www.linkedin.com/pulse/conditional-number-how-same-material-can-return-hardness-iaple/
Frequently Asked Questions:
Does a higher density mean a stronger 3D printed part?
Not reliably. Density describes the voids in a part, while strength is governed by the microstructure of the metal between those voids. Both are set by the same printing parameters, but they don’t respond to parameter changes in the same way, so two parameter sets can close the pores equally well and still produce different metal.
What is relative density in metal additive manufacturing, and why is 99% used as a threshold?
Relative density compares the density of a printed sample against the theoretical density of a fully solid part of the same alloy. A figure at or above 99% is a common threshold in parameter screening because it’s quick and cheap to measure on small 1 cm³ cubes, which makes it a practical way to narrow down a large field of parameter sets early on.
Can two parameter sets with the same density have different mechanical properties?
Yes. In a study of sixteen AlSi10Mg parameter sets printed on an SLM Solutions SLM 500, fourteen cleared 99% relative density. Measured directly, tensile strength across those fourteen varied by almost 20% and yield strength by more than 45%. None of that spread appeared in the density screening.
Why aren’t mechanical properties measured at the parameter screening stage?
Cost and material. Every tensile test coupon needs roughly thirty times the material volume of a 1 cm³ screening cube, on top of slow build times and the expense of destructive testing. For most teams that puts tensile testing out of reach until much later in the process, by which point the parameter sets have already been chosen.
What does it cost to find a mechanical property problem late?
A parameter set that clears the density check and later falls short of mechanical requirements sends a programme back to new parameters, new builds and new tests. Each of those cycles can cost upwards of $10,000, and viable parameter sets can also be discarded early for no reason other than a density figure.
How can mechanical property data be gathered without tensile testing?
Profilometry-based Indentation Plastometry (PIP testing), standardised in ASTM E3499-25, returns stress-strain behaviour from a single indent on samples as small as a nail head. In the AlSi10Mg study it ran on the 1 cm³ density cubes already printed for the density check, cutting the cost of the screening campaign by around 95% and reducing the printing time it needed from over 46 hours to 9.

Henry studied for an undergraduate degreein Natural Sciences from the University of Cambridge before joining theUniversity of Oxford, where he completed a PhD on processing of aluminium matrixcomposites. He then worked for TWI Ltd for 10 years, leading the surface,corrosion and interface engineering team who performed a variety of appliedresearch and consultancy projects across a broad range of industry sectors.
He now manages PLX’s ApplicationEngineering team, whose expert materials scientists provide support tocustomers and ensure they are getting the most out of PIP testing.