How NASA Revealed Hidden Property Variations with PIP Testing


Challenge
Where machining tensile specimens for testing is not an option, hardness is often considered as a solution.
This poses a significant limitation; while hardness testing offers advantages such as affordability, speed, ease of use, and suitability for testing small specimens, a hardness number is not a fundamental material property. Furthermore, practitioners are limited to conversions into a limited set of material property values, as hardness numbers cannot give full stress-strain curves, which means that without further information finite element modelling cannot always be conducted accurately.

Mechanical properties can vary significantly across additively manufactured (AM) parts, driven by changes in local thermal history.
But traditional testing approaches force a compromise. Hardness can sample locally but does not provide a full stress-strain response, while tensile tests measure stress-strain but cannot practically map variation at small length scales.
In spaceflight applications, safety and lightweighting are paramount. But, with incomplete information, large safety factors are often built into designs to compensate, adding extra weight and inefficiency.
Objective
In collaboration with NASA, this case study used Profilometry-based Indentation Plastometry (PIP testing) to uncover property variations across a complex AM part as a means of enabling more efficient, informed design.
Testing
Sample
NASA HR-1 (Fe-Ni superalloy) C-ring, manufactured by Laser Powder Bed Fusion (LPBF).
Measurements
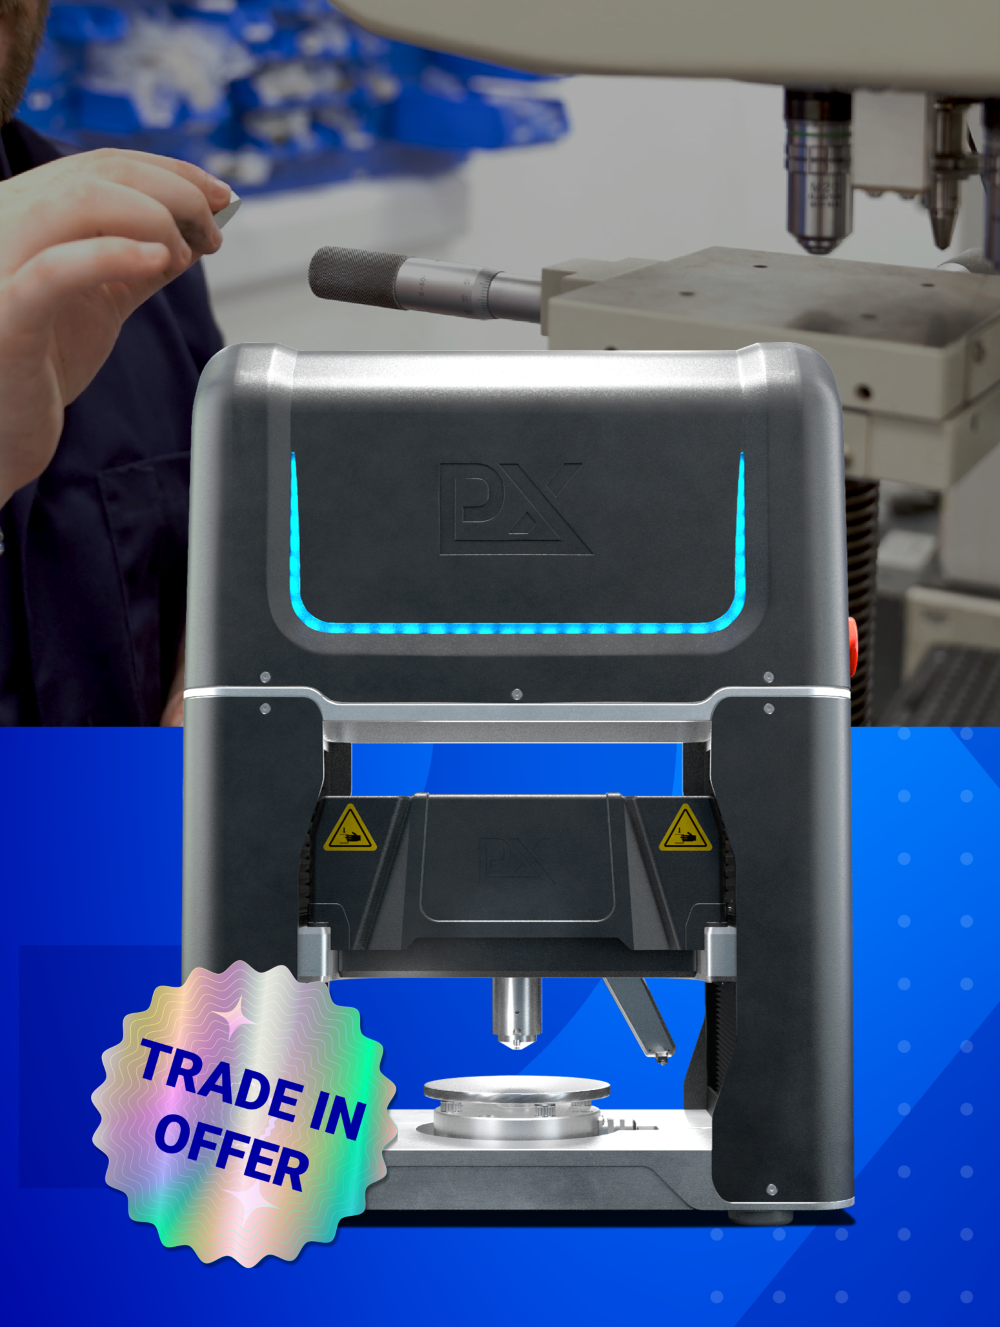
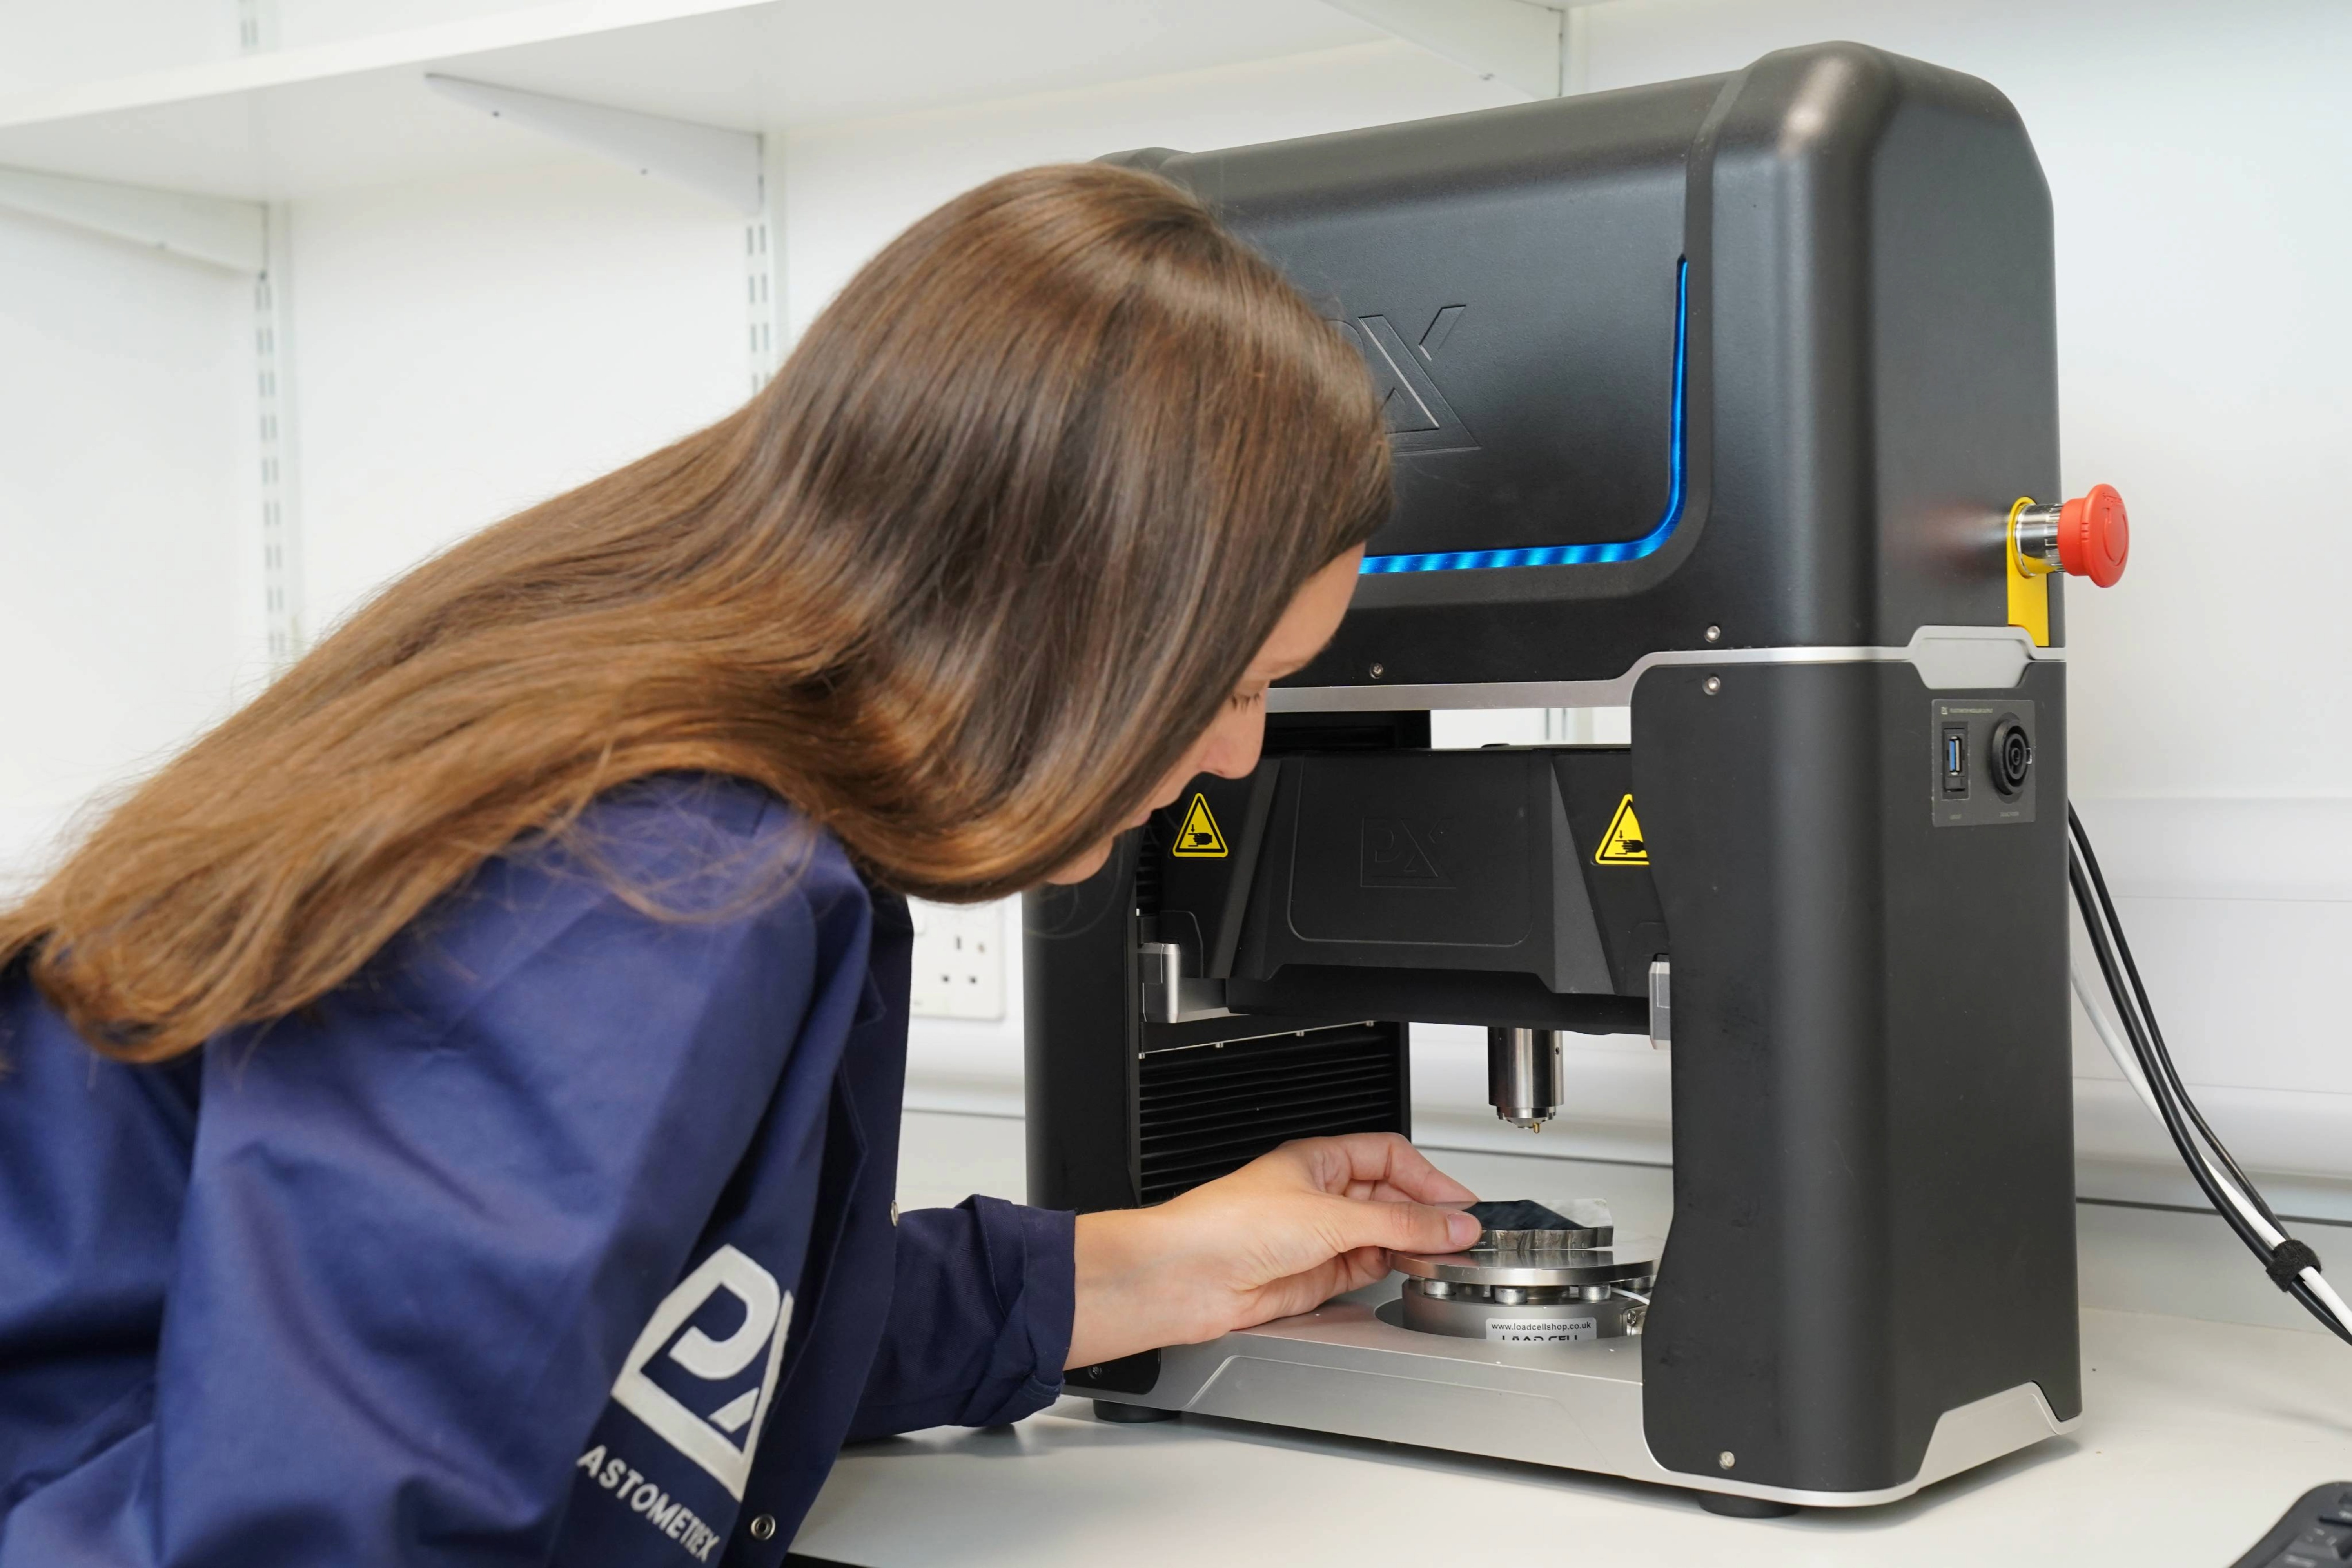
Mechanical properties were measured using the PLX-Benchtop, a compact indentation-based device, equipped with a standard 1mm radius indenter.
Method
Using PIP testing, Plastometrex mapped the bottom surface of the C-ring to create yield stress (YS) and ultimate tensile strength (UTS) maps.

Results

Yield stress fell ~15% (~90 MPa) as wall thickness decreased from 50 mm to 10 mm, while ultimate tensile strength stayed largely constant.
Average PIP results showed strong agreement with NASA’s independent tensile data: YS was within 2.6% and UTS was within 0.4%, confirming the accuracy of the test.
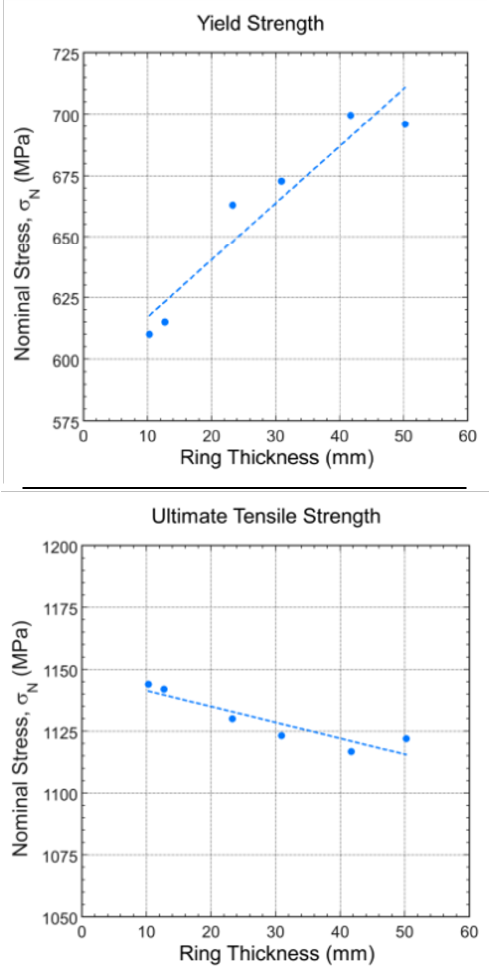
Figure 2: Plot of (a) yield strength and (b) ultimate tensile strength as a function of c-ring thickness showing significant increases in yield strength and minor decreases in UTS as c-ring thickness increases
Conclusion
As demonstrated, hardness testing within failure analysis may be used as a complementary technique to tensile testing. When use of tensile testing is not possible, hardness numbers can provide useful indicators of the resistance to plastic deformation.
Empirical correlations from standards can be used to convert these hardness numbers to UTS values, for a limited subset of alloys. These standards cannot be applied universally and detail that conversions should ‘be used with caution’.
PIP testing revealed variations in strength that would have been missed with conventional methods, giving NASA the data to connect local performance to build conditions and geometry.
With this information, future manufacturing runs can incorporate adjusted print parameters or tailored geometries to maintain structural integrity without compromising safety.