Why a hardness number is the output of a specific test rather than a property of the material itself, and what that ambiguity costs engineering teams who rely on those values for design, procurement, and quality decisions.
Hardness numbers turn up everywhere in engineering. They sit at the top of materials datasheets, get quoted in supplier specifications, anchor incoming inspection routines, and feed into quality control programmes across virtually every industry that makes anything from metal. They look, on paper, like material properties. A single value attached to a material name, presented with the same authority as density or modulus of elasticity.
A hardness number is in fact the output of a specific test, performed with a specific indenter, at a specific load, on a specific surface. Change any of those, and the number changes too, regardless of whether it is testing the same material, by the same standard, in the same lab.
The implications of this matters. A recent case study tested two common engineering materials across the full range of loads permitted by ASTM E92, and the variation is large enough to change the conclusions a design or procurement team would draw from the data.
What hardness testing measures
Hardness testing is one of the most popular mechanical characterisation methods in engineering, valued for being fast, low-cost, and non-destructive. A typical Vickers test takes seconds. An operator presses a diamond pyramid indenter into the surface with a defined load, holds it for a defined dwell time, removes it, and measures the size of the indent left behind. The hardness value is calculated from the applied load and the area of the residual impression.
That sequence captures a recorded outcome of a particular experiment rather than a fundamental property of the material itself. A hardness value records how a specific volume of material, near a specific surface, responded to a specific indenter pushing in with a specific force.
Several variables shape the result: indenter geometry, dwell time, surface condition, microstructure at the test location, and applied load. All are governed by the relevant standards, within defined ranges. Within those ranges, the operator has latitude. Two operators in two labs, both compliant with the same standard, can choose different settings within the permitted range and arrive at different numbers on the same material. It’s easy to see how this could lead to issues down the road.
Why load is the variable that matters most
Of the variables that affect hardness numbers, load has the largest effect. It is the one most often left unreported.
The reason load matters is physical. A smaller load produces a smaller indent. To accommodate the changes in shape, materials must generate geometrically necessary dislocations as well as the statistically stored dislocations found during uniform deformation. The density of geometrically necessary dislocations needed increases as indent size decreases, meaning that at low loads, hardness is much higher.
There’s also then the effects of elastic recovery, where material ‘springs back’ when the load is removed. At low loads, the percentage of elastic recovery (relative to the plastic deformation) is much higher, altering the residual indent shape and making it appear smaller than at peak loading. This too leads to an overestimation of hardness as indent size decreases.
A smaller indent also inevitably sits closer to the surface. Near-surface effects, work-hardened layers, polishing artefacts, grain-scale heterogeneity, and surface oxide films all carry disproportionate weight in the measured response. As the load increases, the indent grows, the volume of material sampled increases, and the measurement averages over a larger and more representative region of the bulk.
The relationship between load and measured hardness is well documented in materials literature and is often referred to as the indentation size effect. The general pattern holds across metals: as the load increases, measured hardness decreases.
How much it decreases is the question. ASTM E92, the standard governing Vickers hardness testing, permits applied loads spanning more than five orders of magnitude, from 1 gf to 120 kgf. Two operators, both compliant with the standard, can choose loads at opposite ends of that range and run tests that both pass every documentary requirement. The numbers they generate, however, will not mean the same thing.

Same material, two different readings.
A recent study examined exactly this effect on two common engineering materials, mild steel and nickel. The same indenter geometry and test procedure were used throughout. Only the applied load was varied, spanning 0.2 kgf to 30 kgf, across the range permitted by ASTM E92.
Measured hardness varied by up to roughly 30% across the tested load range, with a clear and systematic dependence on applied load for both materials. The trend was predictable. At the smallest loads, both materials returned higher hardness values. At the largest loads, the values fell substantially. Every measurement was a valid Vickers reading, compliant with the standard.
A 30% spread carries real engineering weight. For mild steel, the variation moves the measured hardness through the range that would be used to distinguish different grades of carbon steel from one another. For nickel, it spans the gap between values consistent with annealed material and values consistent with cold-worked material. Either reading would be defensible and able to be quoted on a datasheet. Neither would be wrong.
This demonstrates the conditional aspect of hardness measurements. Without the load, the number on its own carries far less information than it appears to.

What the ambiguity costs
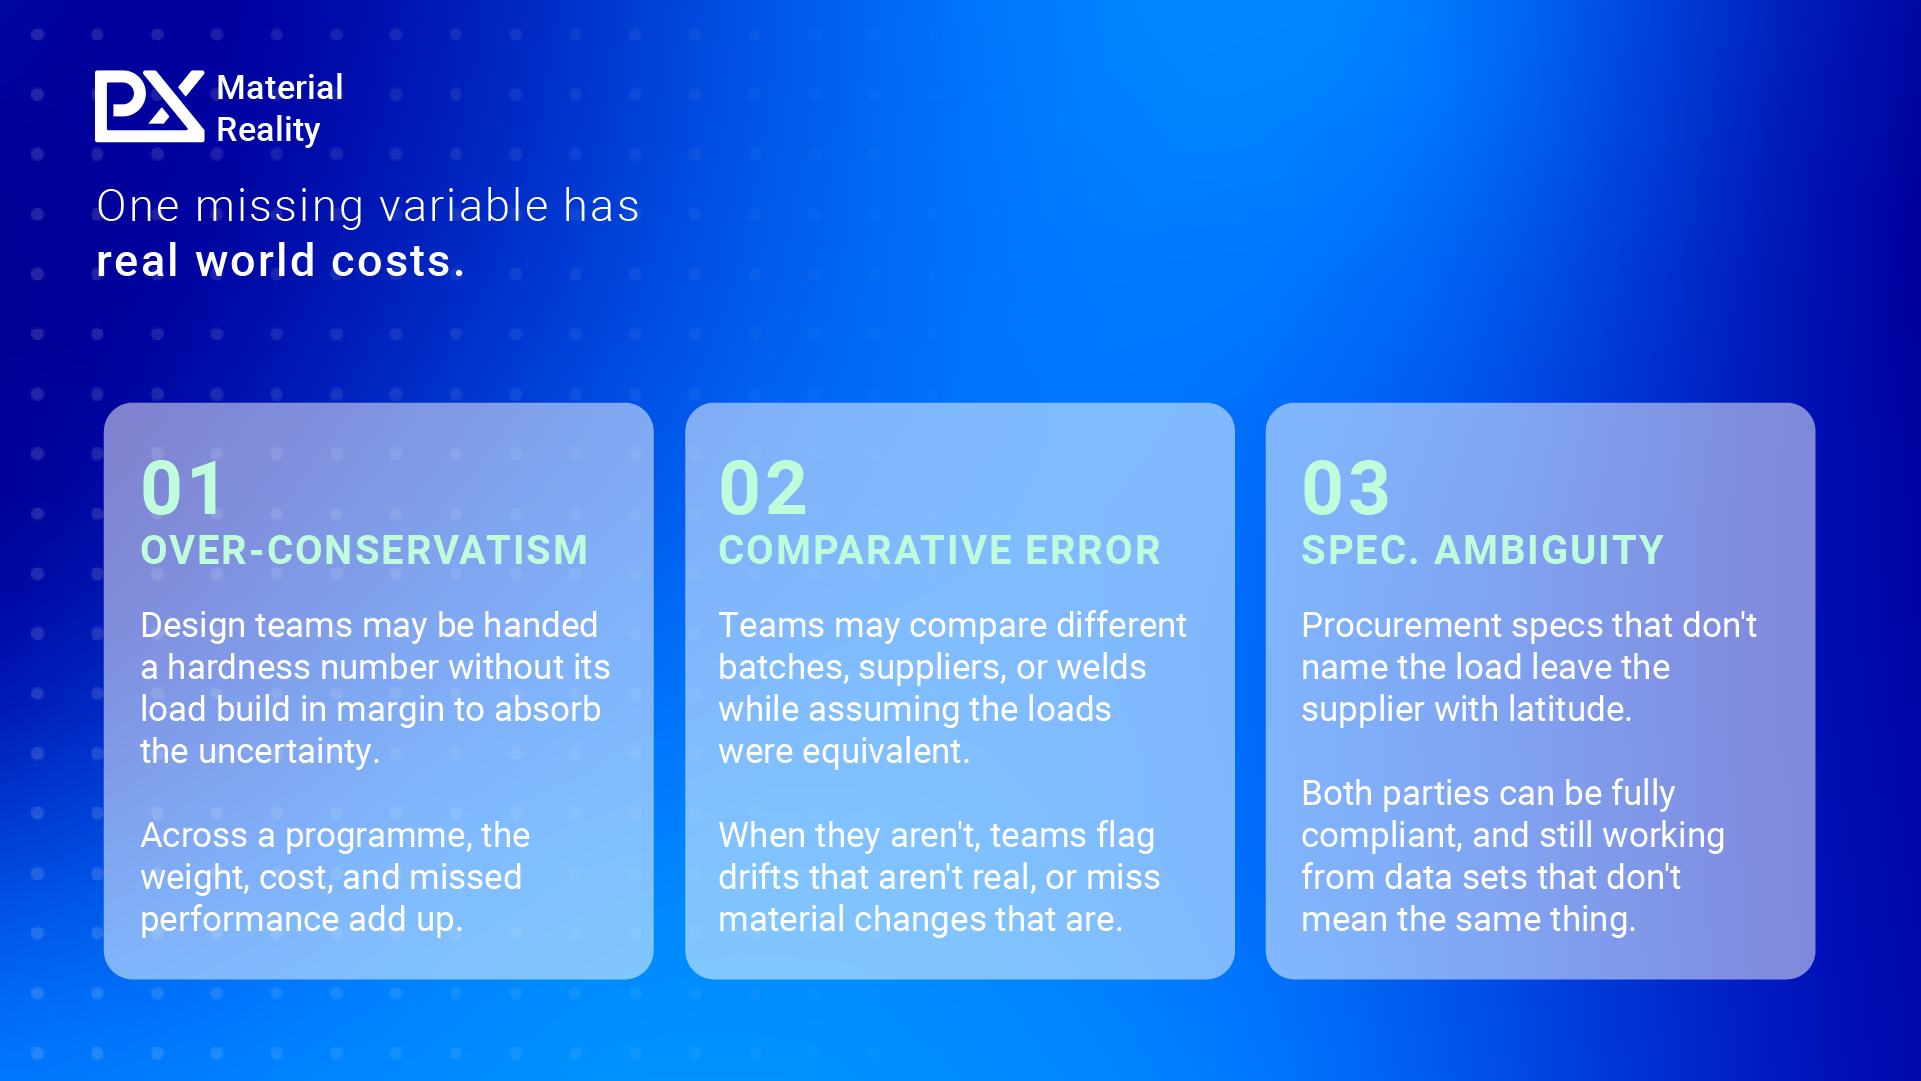
For engineering teams whose decisions depend on reliable data, this ambiguity translates into real cost. The cost takes three forms.
The first is over-conservatism. A design team handed a hardness value without context has to either trust the number at face value or build in margin to absorb the uncertainty. Building margin means larger safety factors, heavier components, and missed performance targets. Across a programme, that margin adds up. For weight-critical applications, it adds up quickly.
The second is comparative error. Hardness data is most often used in comparison, between heat treatments, batches, suppliers, weld passes, or regions of a part. Each comparison assumes the loads were equivalent on both sides. When they aren’t, and the loads aren’t reported, the comparison loses its meaning. Teams may flag a "drift" that is purely an artefact of changed test settings or miss material drift hidden behind a load change.
The third is specification ambiguity. Procurement and incoming inspection routines that call for a hardness range without specifying the load leave the supplier with latitude to choose a load that meets the spec. Both parties can be fully compliant with the requirement as written and still be working from data sets that aren’t comparable. For high-value, safety-critical, or regulated components, that latitude is a liability.
These costs travel through engineering programmes as added weight, scrap, rework, and the occasional in-service surprise.
What to ask, and what to look for
There is one simple solution to many of these issues: communicate the load. Every hardness number, every time, should travel with the load it was measured at. Without that context, the number is a partial record of the test that produced it, rather than a value that can be safely compared or used to underwrite a design decision.
For comparative work, hold the load constant across the comparison and report it explicitly. For specifications, write the load into the requirement. For incoming inspection, ask the supplier to disclose the conditions, and treat hardness numbers that arrive without them as incomplete data.
For applications where transferable mechanical data is needed, hardness is rarely the right tool to begin with. Yield strength and ultimate tensile strength, obtained from conventional tensile testing or from an indentation-based method such as Profilometry-based Indentation Plastometry (PIP testing), return values intended to describe the material itself rather than the conditions of a specific test. Where a design decision depends on what the material will do under load, the data needs to reflect the material.
The question worth asking
The four characteristics that have long made hardness a default screening tool — speed, low cost, non-destructive, and standardised execution — are no longer the deciding factor. Novel competitive methods now tick all the same boxes, but also return real values such as yield strength and ultimate tensile strength: a distinct improvement from the ambiguity that can result from hardness measurements.
Hardness numbers nonetheless continue to appear on datasheets, in specifications, and in supplier reports. As long as they do, the question of how to read those numbers remains. A hardness value loses its meaning unless the test conditions are fully documented and understood. For engineering teams reading datasheets, writing specifications, qualifying suppliers, and making design decisions on the back of hardness numbers, the question worth asking, every time, is straightforward: at what load?
Learn more about PIP Testing and subscribe to the Material Reality Newsletter to get new issues straight to your inbox.

Jimmy co-founded Plastometrex aftercompleting his PhD at the University of Cambridge under Professor Bill Clyneand Dr James Dean. His doctoral research focused on experimental methods andcomputer models for extracting mechanical properties from indentation data, andidentified a fundamental flaw in an analytical calculation method used widelyin the indentation community, demonstrating that problems of that nature couldonly be tackled with advanced numerical modelling. He has published more thanseven peer-reviewed papers on the subject and presented his work at multipleinternational conferences.