The perception that metals yield differently in tension and compression is largely a myth, since the von Mises stress that determines the plasticity response is identical in both cases. This guide explains why the hydrostatic component of stress has no effect on plasticity, how friction and barrelling distort compressive stress-strain curves, and how FEM modelling characterises the friction coefficient from the barrelled shape. It then covers the genuine sources of asymmetry in porous materials and transformation-hardening steels, and separates all of this from the Bauschinger effect, where prior plastic strain lowers the yield stress on reverse loading.
Testing in (uniaxial) compression is sometimes an attractive alternative to tensile testing. Specimens can be simpler in shape and smaller, since there is no gripping requirement. The key question is whether corresponding information can be obtained. In general, it can, butt here is sometimes a perception that at least some materials behave differently under compression - i.e. that there is tensile-compressive asymmetry in their response. In fact, this is largely a myth. At least in the majority of cases, the underlying plasticity response is symmetrical. The von Mises (deviatoric) stress, which is normally taken to be the determinant of the response, is identical in the two cases. However, caveats are needed. If the material response is indeed dependent on the hydrostatic component of the stress, as it might be for porous materials and for those in which a phase transformation occurs during loading, then asymmetry is possible. Also, while the underlying plasticity response is usually the same, the compressive stress-strain curve is often affected by friction between sample and platen (leading to barrelling). Conversely, the necking that may affect the tensile curve cannot occur in compression. It's also important to distinguish the concept of tension /compression asymmetry from that of the Bauschinger effect (a sample pre-loaded in tension exhibiting a different response if then loaded in compression).
Tension/Compression Asymmetry
1.1 Stimulation of Plasticity by Stresses
There is quite frequent reference in the literature to “tension/compression asymmetry”, meaning a difference between the inherent (plasticity) responses of a material when subjected to (uniaxial)compression or tension. It may first be noted that such asymmetry would invalidate some of the basic assumptions that are commonly made when treating metal plasticity. The plastic deformation of metals is stimulated by shear stresses (which cause movement of dislocations and may also stimulate deformation twinning). These are represented by the deviatoric (“shape-changing”) component of the stress state. For an arbitrary stress state(set of principal stresses), the peak shear stress can be obtained using the Mohr's circle construction [1], as shown in Fig.1. It is given by half the difference between the largest and smallest of the principal stresses. The hydrostatic (“volume-changing”) component of the stress state, which would be altered by moving the set of circles in Fig.1 along the x-axis, has no effect on the plasticity. This is consistent with the fact that plasticity involves no change in volume.
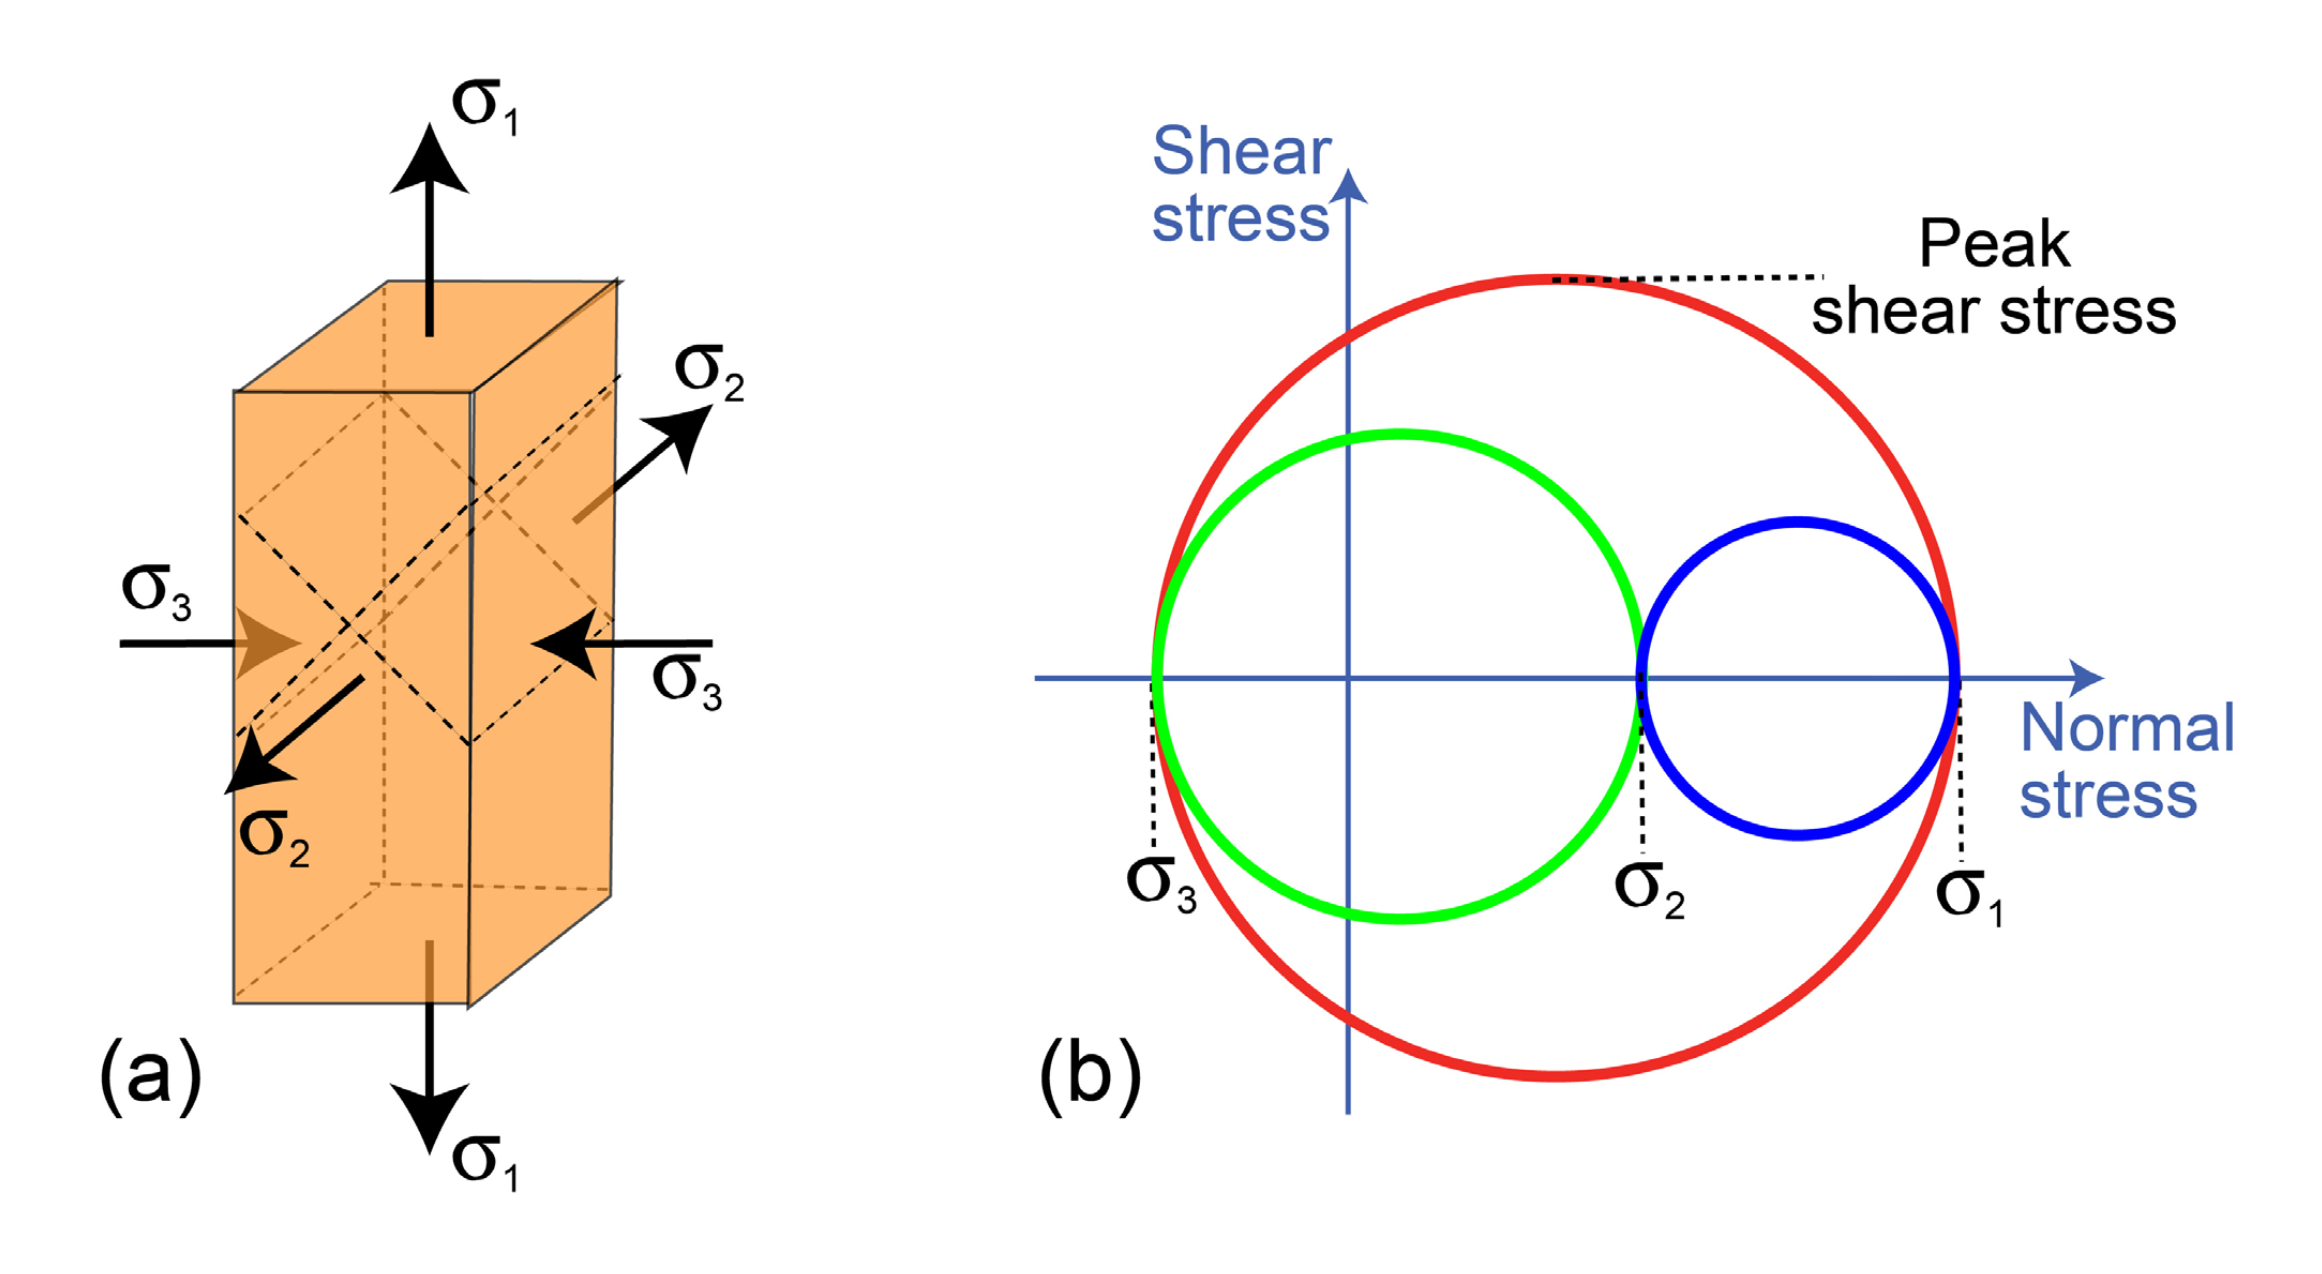
When predicting how plasticity will be stimulated by a general stress state - for example via FEM modelling - the(true) stress-strain relationship of the material is implemented using the von Mises stress and the von Mises strain (equivalent plastic strain). These are effectively volume-averaged shear stresses and strains, related to the principal values by
σvM = √( [ (σ1 – σ2)² + (σ2 – σ3)² + (σ3 –σ1)² ] / 2 )
εvM = √( [ (ε1 – ε2)² + (ε2 – ε3)² + (ε3 –ε1)² ] / 2 )
where these strains refer to plastic values. It can be seen from the form of these expressions that both the von Mises stress and the von Mises strain are always positive scalar quantities. For the simple case of uniaxial loading (σ1 ≠ σ2 = σ3 = 0), the von Mises stress is the same (positive with a magnitude of σ1), whether σ1 itself is tensile or compressive (ie has a positive or a negative sign).
Of course, the fact that tension/compression asymmetry would invalidate much of the current handling of plasticity is not in itself a basis on which to dismiss claims that it can be observed, which should naturally be scrutinised on their merits, both in terms of experimental evidence and from a theoretical point of view.
1.2 Tensile and Compressive Testing - Nominal and True Stress-Strain Plots
The standard outcome of a tensile test is a plot of nominal stress against nominal strain. Conversion between true and nominal values of stress and strain is straightforward, using simple analytical equations, although it is important to understand that these conversions are only valid if the stress and strain fields within the sample (gauge length) are uniform (homogeneous) - which can only be true prior to the onset of necking.In practice, it is common to present only the nominal plot, and several procedures for extraction of key parameters are based only on inspection of such curves.However, if the objective is to obtain fundamental information about the plasticity (and failure) characteristics of the material, then it is a plot of true stress against true strain that provides this.
For compressive testing, it's also a simple matter to convert an experimental (nominal) stress-strain curve to one expressed as true values, based on the assumption of uniform stress and strain fields. Representative stress-strain curves [2] are shown in Fig.2, for Cu samples in two different conditions - as-received and annealed. The comparison shown in Fig.2(c) is between the true plots obtained from the tensile and compressive tests. It should first be understood that the tensile-derived plots are not expected to be valid beyond the necking point. Moreover, the compressive-derived plots are likely to be influenced by friction (and hence to be invalid) from the start, although the effect may be small initially(particularly if there was effective lubrication).
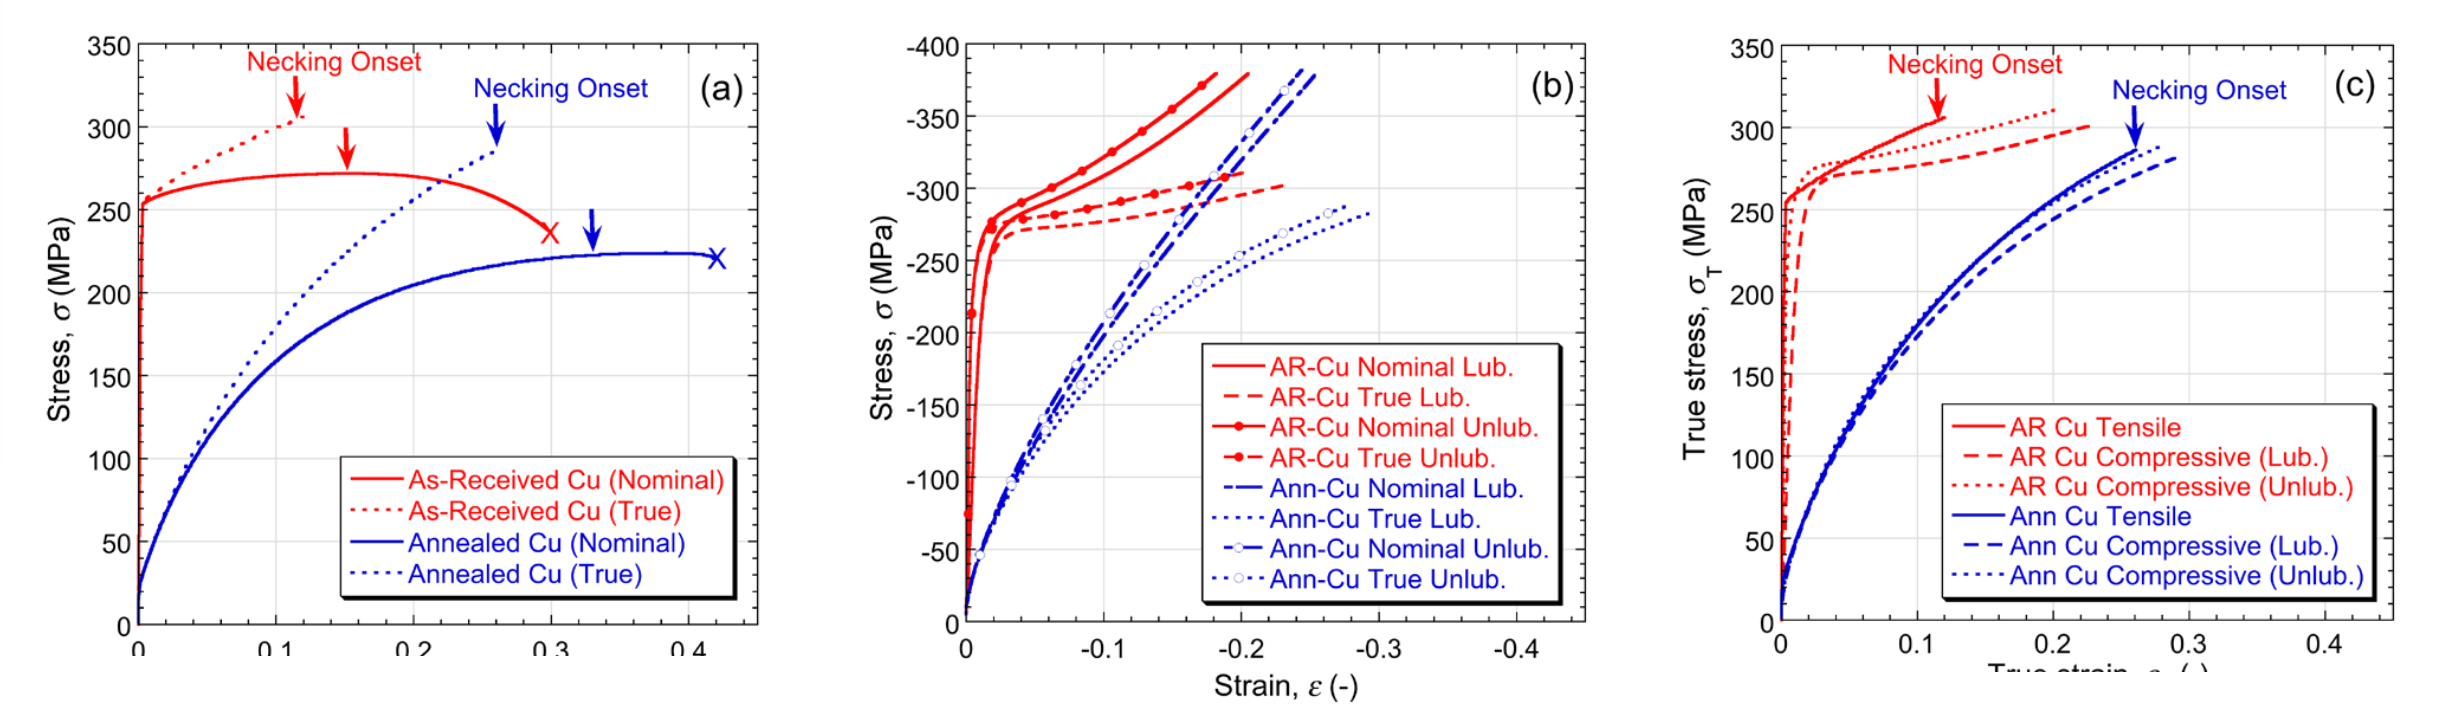
It can be seen that there is certainly a large measure of agreement. The discrepancy is probably attributable to the squeezing out of lubricant during the test, which raises the apparent strain (to a degree that increases as the stress is raised). This could have been eliminated if the strain had been measured directly on the sample, rather than between the platens, although this is often not easy to do with compression testing. In fact, the agreement with the tensile curves is better if the un-lubricated compressive plots are used. In this case there was no squeezing out of lubricant, although the error arising from frictional effects would be expected to be greater than for the lubricated case. These data suggest that such effects were relatively small in this case. This demonstrates that, in general, the same underlying(plasticity) characteristics are obtained from tensile and compressive testing, although they also highlight that certain effects need to be taken into account in order to avoid the conclusion that there is some kind of(tensile/compressive) asymmetry. Genuine asymmetry of this type is possible, but in fact is quite rare - see below.
1.3 FEM Modelling of Compression, Friction and Barrelling
As outlined above, it is difficult to eliminate friction at the sample/platen interface. It is easy to recognise that such interfacial friction commonly plays a role, since it leads to the development of a “barrel” shape (for a sample that is initially cylindrical).In practice, this is very common. Also, by measuring the diameter at the top and bottom of the sample at the end of the test, and comparing it with the initial sample diameter, it's possible to check whether there has in fact been any interfacial sliding.
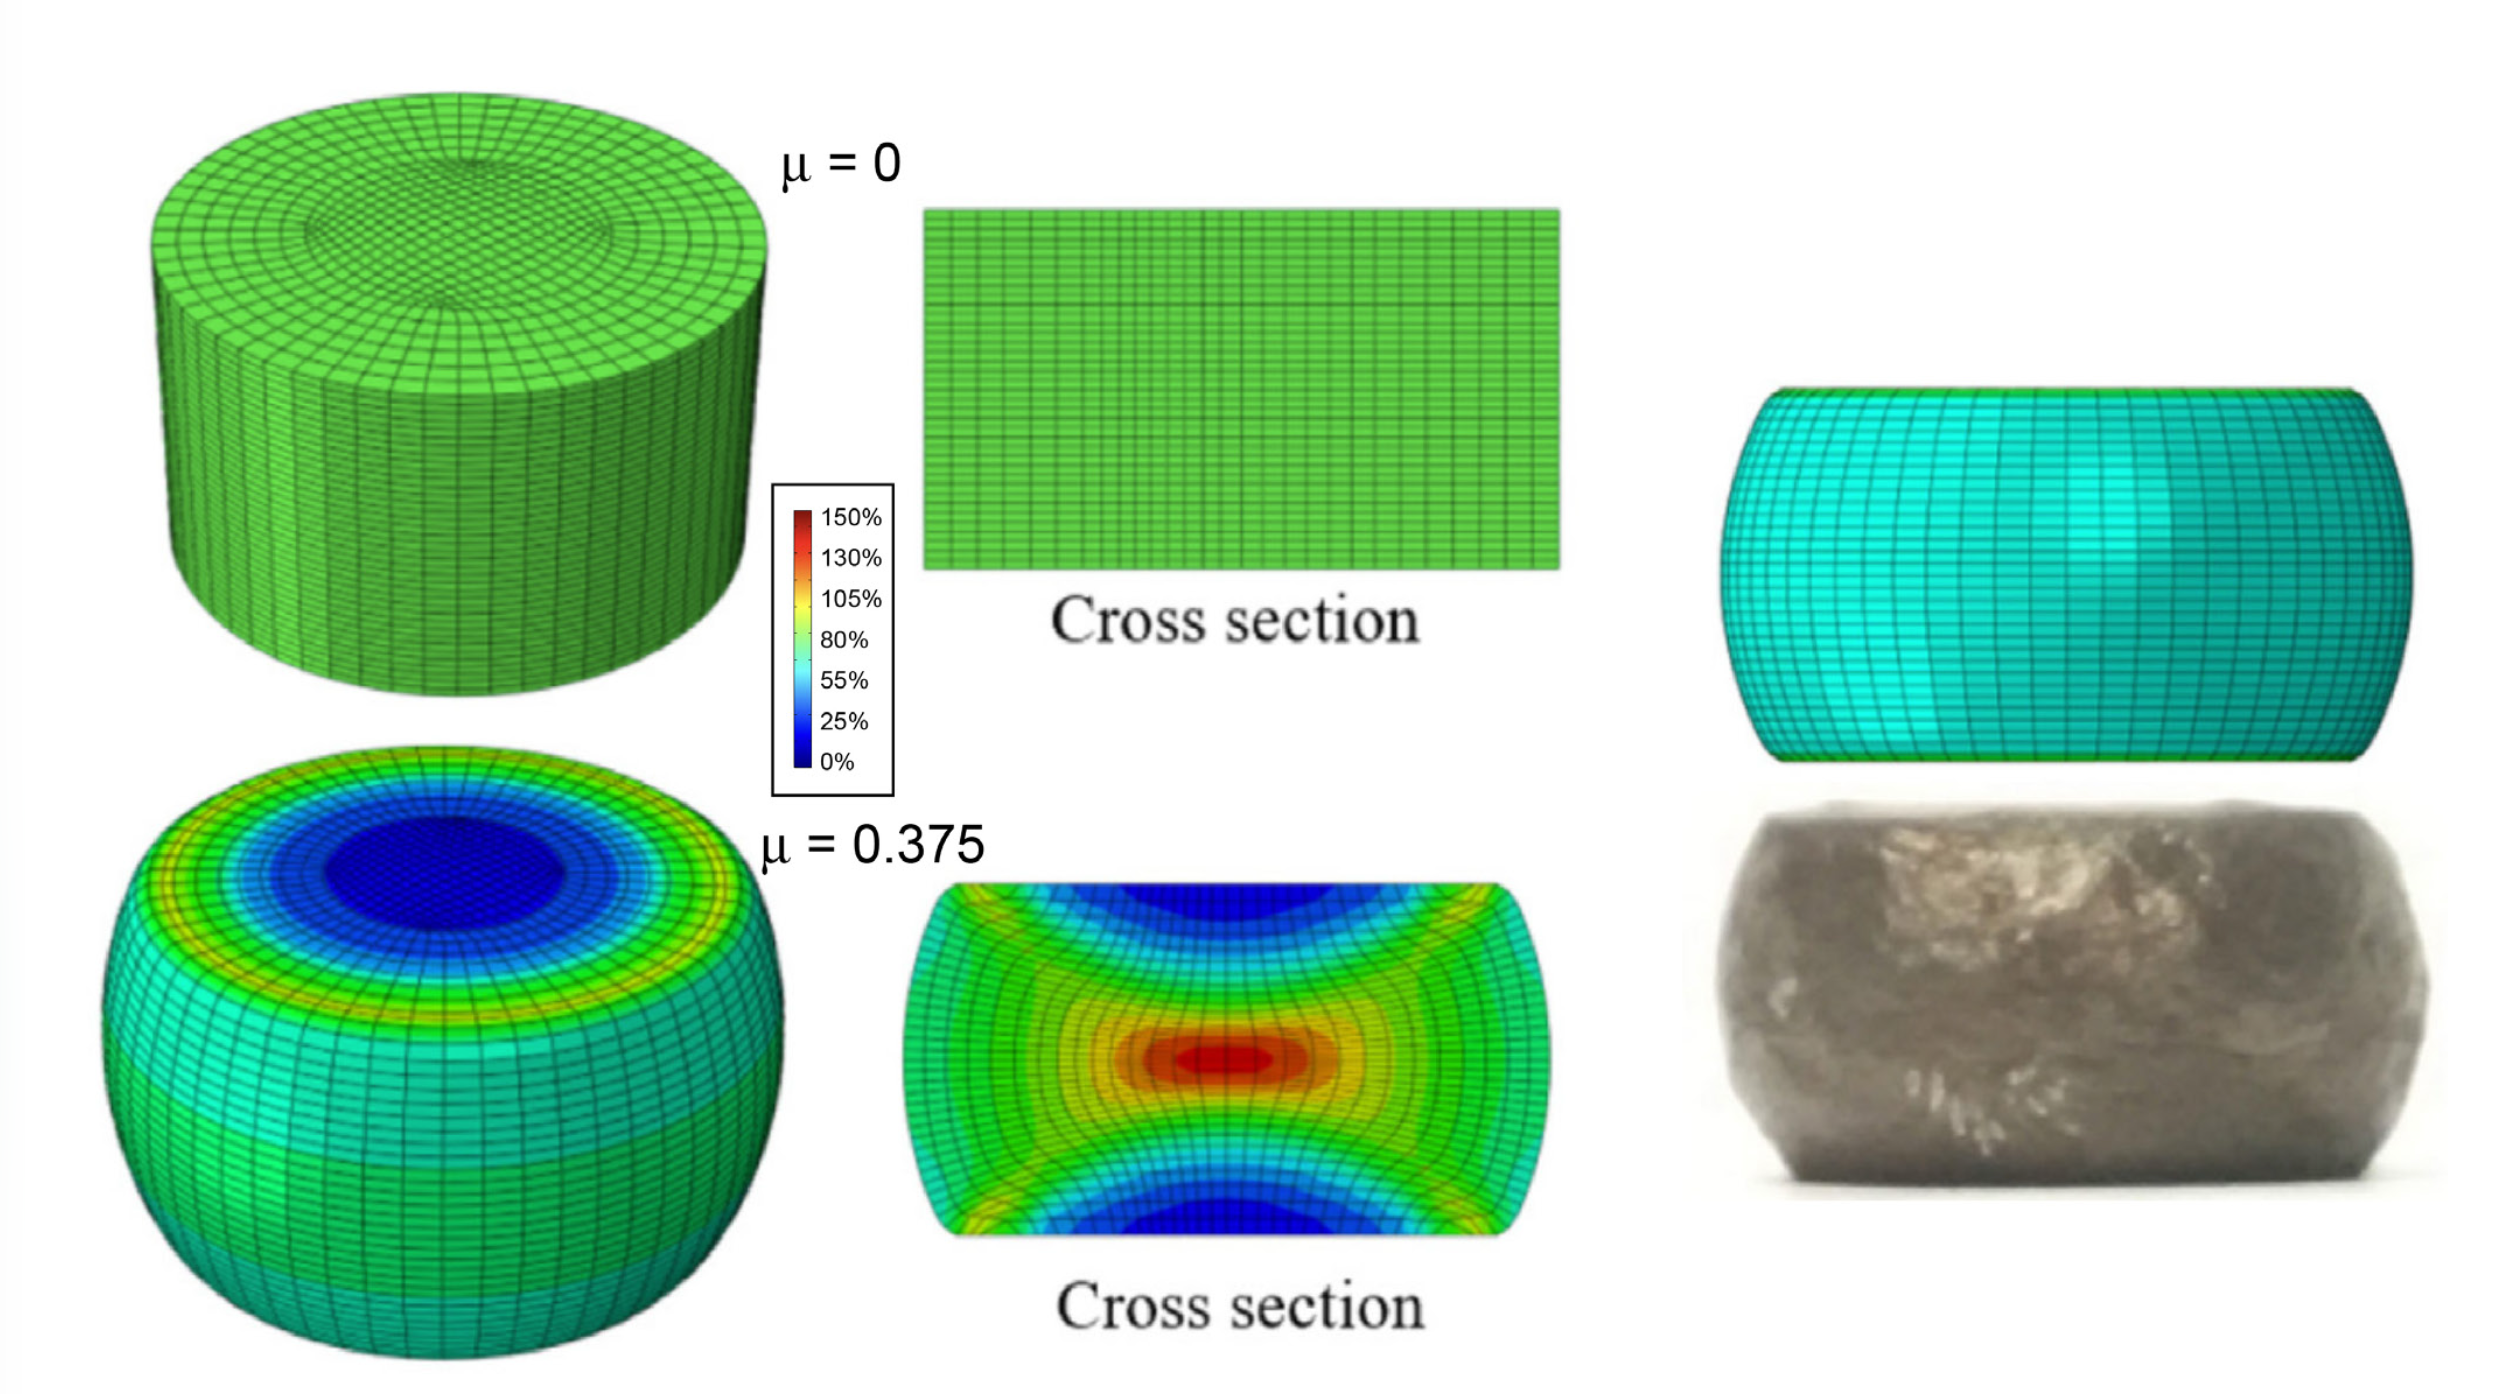
On a more quantitative level, if the (true)stress-strain relationship of the material is known, then FEM simulation of the compression test can be used to characterise the friction conditions, via an inverse (iterative) modelling sequence - this is the same type of methodology as that used in PIP testing to obtain a stress-strain relationship. This characterisation most commonly takes the form of a value for the coefficient of friction, μ, which is the ratio of the shear stress necessary for interfacial sliding to the normal (compressive) stress on the interface. Some results illustrating the approach are shown in Fig.3. This shows strain fields after an axial compression of about -50% (nominal, which corresponds to a true strain of about -70%). Clearly, frictional effects can cause the strain field to become highly inhomogeneous.
An indication is also given in Fig.3 of how the barrelling shape can be used as an experimental outcome to guide evaluation of the friction coefficient (once the true stress-strain relationship of the material has been obtained). In the work concerned, which was carried out at high temperature (~1000-1200˚C), over a range of strain rate, the best-fit value of μ was found to be about 0.375. This is a relatively high value, although that is often the case for processing carried out at high temperature.
It's also possible to use FEM simulation to predict stress-strain curves in compression, taking account of frictional effects, and using the true stress-strain relationship. A comparison [2] is shown in Fig.4(b) between predicted and experimental stress-strain curves, for the two types of copper, with and without lubrication. Friction is clearly relevant and can be captured via a value of μ but there may also be an initial “bedding down” effect that presents a complication in terms of comparing model predictions with experiment.
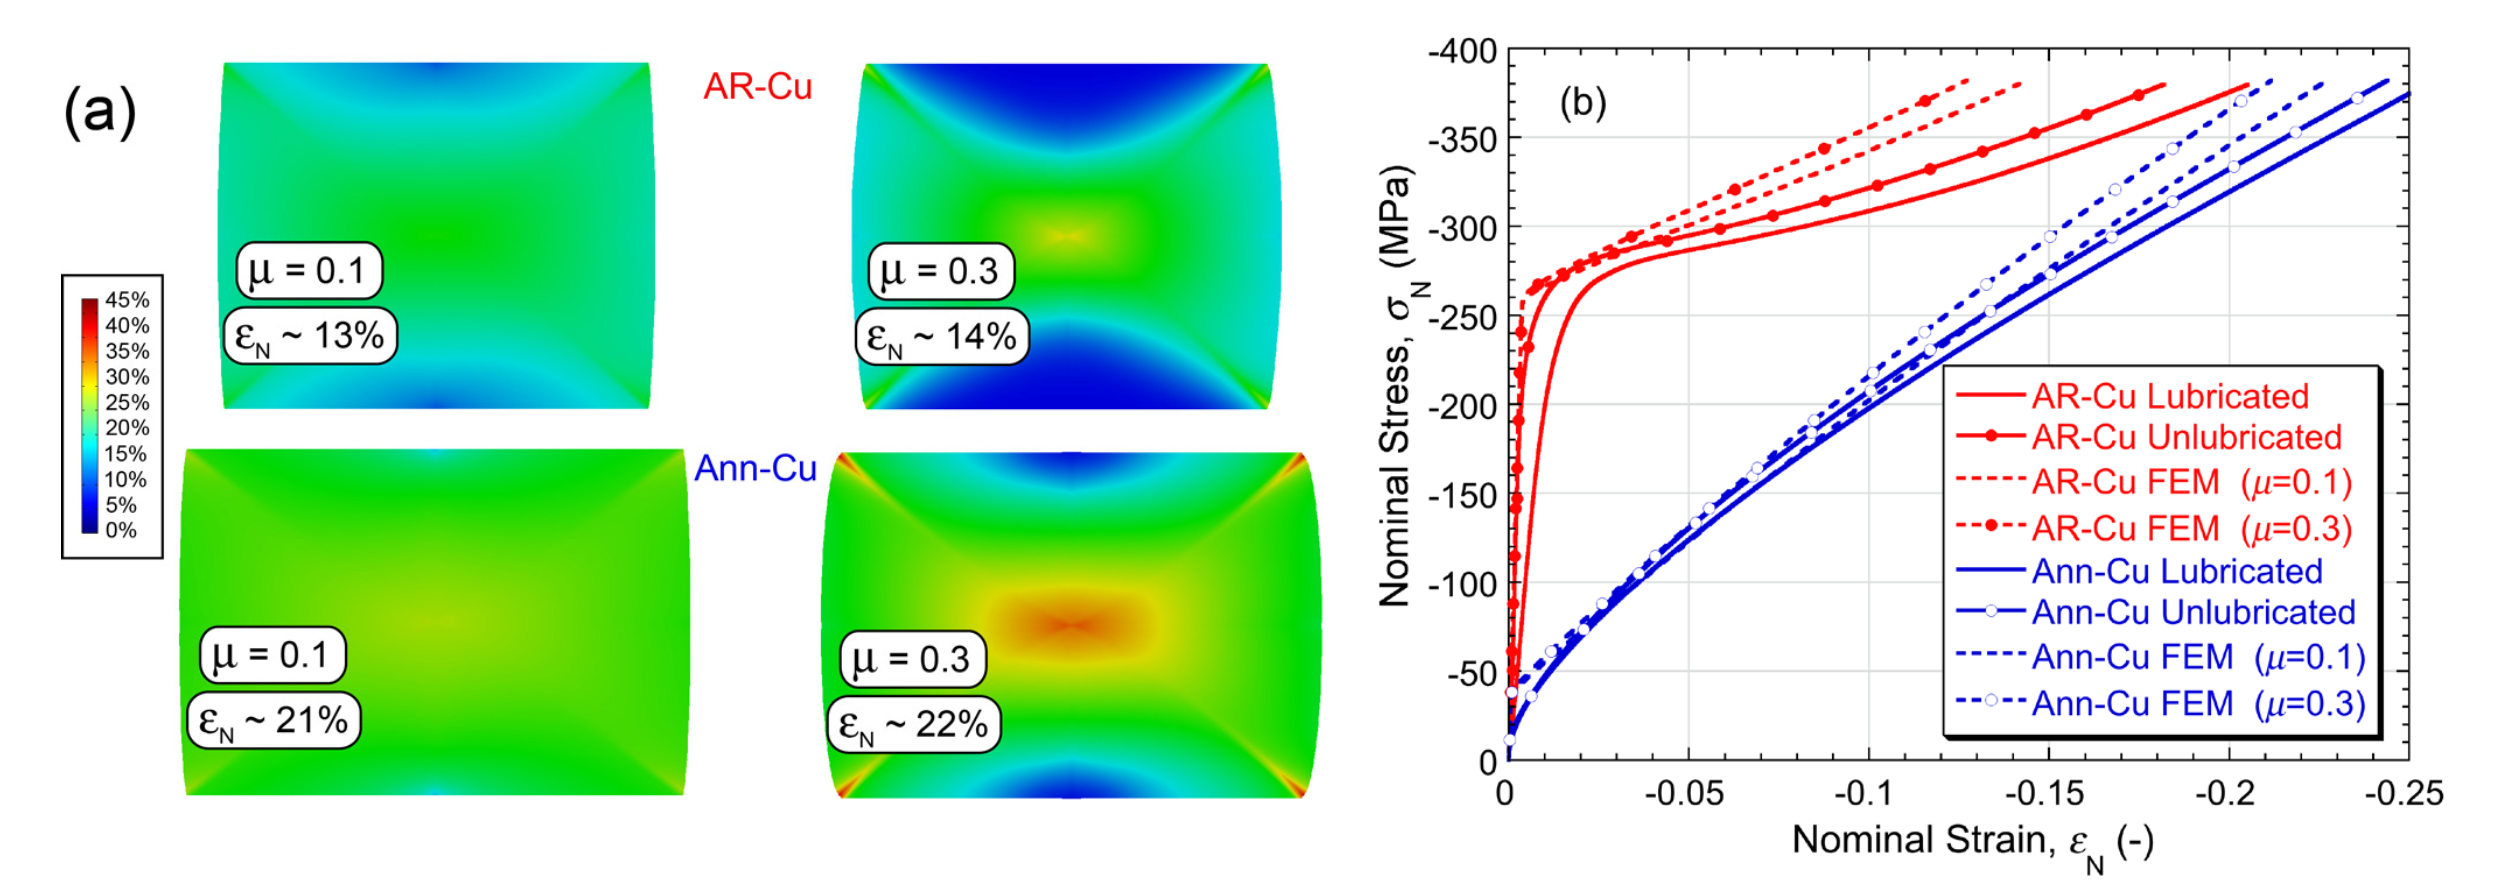
What was done here was to use the two best fit sets of plasticity parameter values (obtained from tensile comparisons [2]).There is information available in the literature about likely values of μ under different conditions [4-8]. A value in the approximate range 0.1-0.3 has often been found appropriate for un-lubricated compression, although clearly there maybe a dependence on surface finish, materials etc. During lubricated compression testing, there tends to be more variation, but a value of the order of 0.05-0.1might be considered typical with good lubrication. Accepting that accurate estimation of μ is difficult, and also that it may change during the process, values of 0.1 and 0.3 were used in the work of Fig.4, designed to correspond to the lubricated and un-lubricated cases. It can be seen that, for both materials, there is a fairly good level of agreement between experiment and prediction.The differences between the high and low μ predictions are certainly similar to those of the two experimental conditions. There is clearly an error associated with the “bedding down” process, leading to larger strains over the complete range for the experimental plots. Accepting this, however, and recognising that, for the most accurate comparisons, it is probably best not to use compressive uniaxial data, the level of consistency is good (confirming that the plasticity characteristics are being well-captured by these two parameter sets for these two materials).
A general conclusion about compressive testing is that, while it can be used to obtain reliable information about the underlying plasticity response of the material, it is more susceptible to the effects of variables that are difficult to pin down accurately than is the case with tensile testing. Of course, tensile testing has various disadvantages and there are strong arguments for using PIP, which is even easier and more versatile than compressive testing, and is potentially more reliable and accurate.
1.4 Possible Sources of Genuine Asymmetry
It should also be emphasised that, for certain types of material, a dependence on the hydrostatic component of the stress state IS expected. The most obvious of these is porous materials, which can for these purposes be regarded as those with porosity levels above a few %. Pores are likely to become closed when the hydrostatic stress is negative(compressive) and opened up when it is tensile. This will certainly lead to different (plasticity) responses in tension and compression, although, since it might be expected to effectively reduce the hardness in both cases, the expected direction of the asymmetry is not immediately clear. It is in any event recognised in the literature [9-11] that asymmetry can arise in such materials.
A little less obvious is that asymmetry might also be expected when the plasticity is accompanied by a phase transformation(with an associated volume change). If the volume decreases during the phase change, then it will be promoted by a compressive hydrostatic stress and vice versa. A key issue here is the magnitude of the volume change, which might be very small (in which case the effect is expected to be weak). However, phase transformations can in some cases be accompanied by quite significant volume changes.Those stimulated by mechanical loading are likely to be martensitic (diffusionless), since these can occur quickly. Indeed, some of the reports of tensile/compressive asymmetry do relate to such materials [12-14].
There are, of course, various types of material in which mechanically-induced martensitic transformations can occur.These include shape memory alloys, which are not so common, but also certain types of steel, which are much more widely used. Indeed, the class often referred to as TRIP (Transformation-Induced Plasticity) steels [15, 16] has the mechanical stimulation of martensitic transformations as a basic characteristic. This type of deformation also often occurs in the so-called “Dual Phase” steels. These are high strength steels with good formability, usually having a ferrite-based microstructure containing relatively high levels of martensite. The (soft) ferrite gives a relatively low yield stress, but the(hard) martensite, and potentially the formation of further martensite during the loading, confers a high work hardening rate, so the UTS of such materials is high.
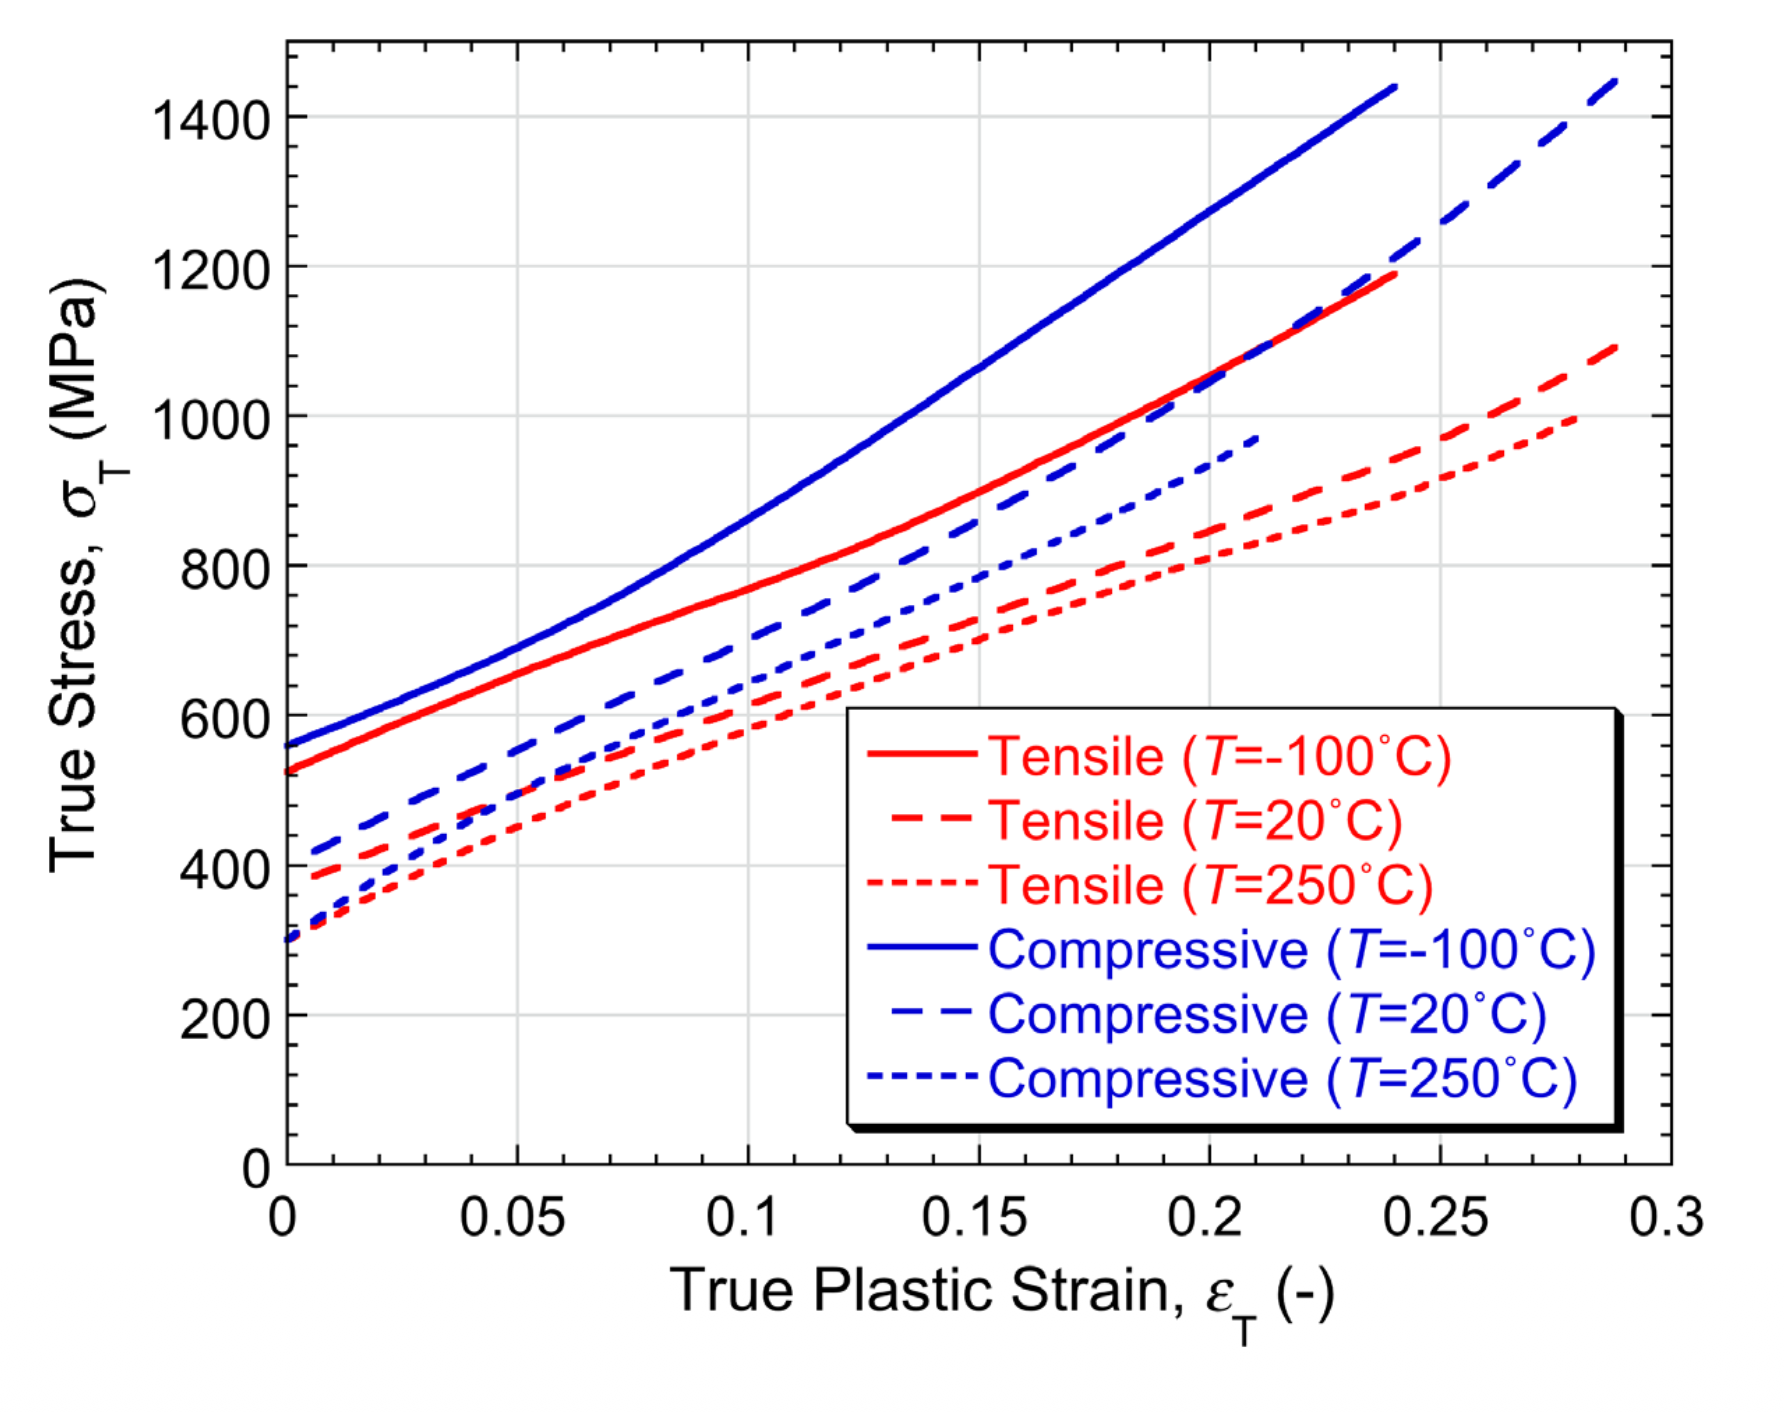
Similar hardening as the load is increased, also largely due to stimulation of phase transformations, also occurs in Hadfield's Manganese steel (“Mangalloy”). Fig.5 shows true stress – true strain plots obtained from tensile and compressive tests, for such a steel. The high work hardening rate, raising the flow stress by about 1 GPa over a strain range of about 25% (i.e. a more or less linear work hardening rate of about 4 GPa),is immediately apparent. It also seems clear that there is at least some tensile/compressive asymmetry, with the material being harder in compression than tension. Caveats should, however, be appended to this. Conversion from nominal to true curves was apparently carried out using the analytical relationships. For the tensile plots, which were unaffected by necking, this should be accurate. For the compressive ones, however, friction probably had an effect. There is no reference in the paper to lubrication or assessment of friction and it is possible that the observation of higher flow stress values in compression is largely attributable to frictional effects. Nevertheless, it is possible that at least some genuine asymmetry was arising from the contribution of phase transformations to the straining, although any such effect was probably small.
In general, it seems clear that many of the reports of asymmetry, which certainly cover many systems in which there is neither porosity nor stimulation of martensitic phase transformations during loading, actually arose entirely from imperfect conversion of the raw data to true stress-strain curves. As outlined above, it is not a simple matter to carry out these conversions to high accuracy, particularly for compressive testing, and there are very few reports in which a large and unambiguous asymmetry has been found experimentally. It should also be mentioned that there have been various attempts to provide a theoretical basis for tensile/compressive asymmetry. Many of these involve arguments about dislocation mobility and/or twinning, often invoking crystallographic texture in some way to explain the asymmetry [18-20]. It is, of course, possible that individual explanations may have some validity, but in general it appears unlikely that these mechanisms would lead to strong asymmetries of any sort. In some cases, there may be some confusion with the Bauschinger effect, a well-established phenomenon that is described in the next section. As a generalisation, neglect of the hydrostatic component of the stress state in an analysis of plasticity characteristics is usually an acceptable assumption.
The Bauschinger Effect
This effect was first identified in 1881 by Johann Bauschinger. He observed that, when a sample was deformed plastically intension, and then tested in compression, the yield stress was lower than it had been in tension. This is, of course, a different effect from that of a tensile/compressive asymmetry (for testing of different samples of the same material). It suggests that something has happened during the first test that has affected its response during the second test (and, in practice, the effect is often investigated via cyclic tests, with repeated reversal of the sense of the loading). It has been the subject of extensive investigation [21-23], which has revealed that it occurs in single crystals, as well as polycrystalline samples. A schematic plot, and some experimental data, are shown in Fig.6. The phenomenon can be regarded as broader than just a dependence of the flow stress on prior loading in the reverse direction, since it raises the possibility of any plasticity characteristics being dependent on prior strain history, potentially creating anisotropy.
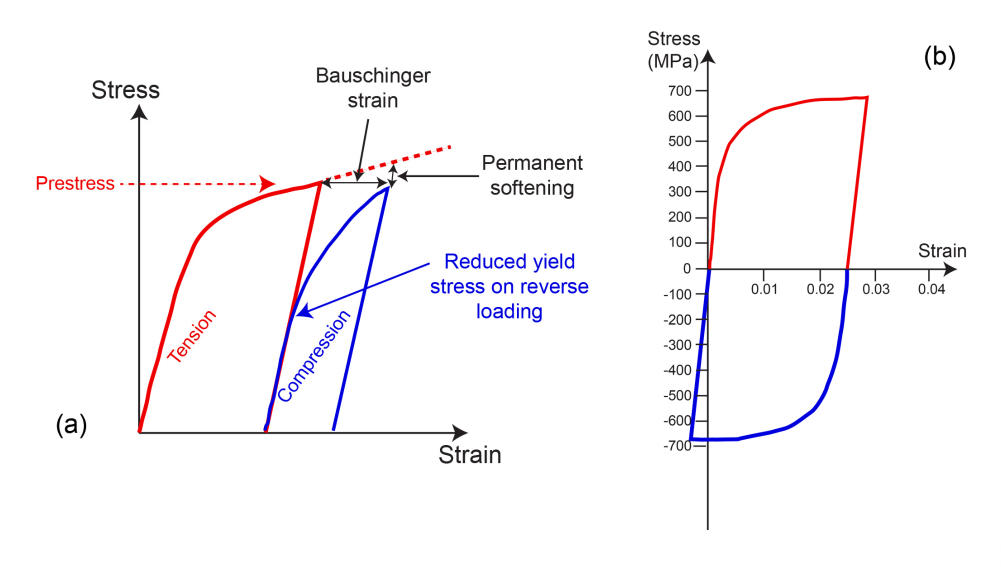
There are several different ways in which the effect has been explained, but the main proposed mechanisms are based either on the generation of residual stresses or on dislocation mobility. The concept of a “back-stress” is central to both approaches. The idea of the initial(tensile) loading creating residual stresses that facilitate yielding under the reversed (compressive) load has been popular. However, a simple uniaxial test, with uniform stress and strain fields, should not create any residual stresses- these arise only when there is some kind of differential straining (and they must force balance to zero when integrated over the sample). If the effect is to be explained in terms of residual stresses, then they must be local ones(that facilitate reverse plasticity). Explanations also focus on dislocation motion becoming inhibited (in the “forward” direction) during plastic deformation, but then being easier when the loading is reversed. Initially, it was envisaged that this inhibition was largely in the form of “pile-ups” at grain boundaries, but observation of the effect in single crystals made it clear that grain boundaries were not essential. Nevertheless, the most plausible explanation is that dislocations have encountered various kinds of obstacles, tangles etc (when moving in one direction) and that it is easier, at least initially, for them to start moving in the reverse direction. It's also possible to explain this in terms of (residual) local stress fields.
Of course, such a situation (ie dislocations being “pinned” in some way, and inhibited from continuing to move in the directions being promoted by the applied load) could exist in various samples, particularly those in a “work hardened” state – for example after being extruded or rolled etc. Equivalently, this situation could be considered in terms of the presence of residual stresses. Such states could even give rise to a tensile/compressive asymmetry. It can, however, be argued that this is rather unlikely, since metal-working processes of this type tend to create rather complex residual stress fields that would balance out over the sample as a whole in terms of their effect during a uniaxial test. On the other hand, for hardness testing or indentation plastometry, in which only small parts of a sample are being mechanically interrogated, the residual stress in the part concerned may influence the outcome of the test (with potential scope for measuring the residual stress in the region concerned).
References
1. Clyne, T.W. and J.E. Campbell, Testing ofthe Plastic Deformation of Metals. 2021, Cambridge, U.K.: Cambridge UniversityPress.
2. Campbell, J.E., R.P. Thompson, J. Dean andT.W. Clyne, Comparison between stress-strain plots obtained from indentationplastometry, based on residual indent profiles, and from uniaxial testing. ActaMaterialia, 2019. 168: p. 87-99.
3. Wang, X., H. Li, K. Chandrashekhara, S.A.Rummel, S. Lekakh, D.C. Van Aken and R.J. O'Malley, Inverse finite elementmodeling of the barreling effect on experimental stress-strain curve for hightemperature steel compression test. Journal of Materials Processing Technology,2017. 243: p. 465-473.
4. Fardi, M., R. Abraham, P.D. Hodgson and S.Khoddam, A New Horizon for Barreling Compression Test: Exponential ProfileModeling. Advanced Engineering Materials, 2017. 19(11).
5. Bol, M., R. Kruse and A.E. Ehret, On astaggered iFEM approach to account for friction in compression testing of softmaterials. Journal of the Mechanical Behavior of Biomedical Materials, 2013.27: p. 204-213.
6. Torrente, G., Numerical and ExperimentalStudies of Compression-Tested Copper: Proposal for a New Friction Correction.Materials Research-Ibero-American Journal of Materials, 2018. 21(4).
7. Fan, X.G., Y.D. Dong, H. Yang, P.F. Gao andM. Zhan, Friction assessment in uniaxial compression test: A new evaluationmethod based on local bulge profile. Journal of Materials ProcessingTechnology, 2017. 243: p. 282-290.
8. Duran, D. and C. Karadogan, Determinationof Coulomb's Friction Coefficient Directly from Cylinder Compression Tests.Strojniski Vestnik-Journal of Mechanical Engineering, 2016. 62(4): p. 243-251.
9. Deng, X., G.B. Piotrowski, J.J. Williamsand N. Chawla, Effect of porosity and tension-compression asymmetry on the Bauschinger effect in porous sintered steels. International Journal of Fatigue,2005. 27(10-12): p. 1233-1243.
10. Stewart, J.B. and O. Cazacu, Analyticalyield criterion for an anisotropic material containing spherical voids andexhibiting tension-compression asymmetry. International Journal of Solids andStructures, 2011. 48(2): p. 357-373.
11. Alves, J.L., M.C. Oliveira, L.F. Menezesand O. Cazacu, The role of tension-compression asymmetry of the plastic flow onductility and damage accumulation of porous polycrystals. Ciencia &Tecnologia Dos Materiais, 2017. 29(1): p. E234-E238.
12. Grolleau, V., H. Louche, V. Delobelle, A.Penin, G. Rio, Y. Liu and D. Favier, Assessment of tension-compressionasymmetry of NiTi using circular bulge testing of thin plates. ScriptaMaterialia, 2011. 65(4): p. 347-350.
13. Ma, J., B. Kockar, A. Evirgen, I. Karaman,Z.P. Luo and Y.I. Chumlyakov, Shape memory behavior and tension-compressionasymmetry of a FeNiCoAlTa single-crystalline shape memory alloy. ActaMaterialia, 2012. 60(5): p. 2186-2195.
14. Bucsek, A.N., H.M. Paranjape and A.P.Stebner, Myths and Truths of Nitinol Mechanics: Elasticity andTension-Compression Asymmetry. Shape Memory and Superelasticity, 2016. 2(3): p.264-271.
15. Kim, H., J. Park, Y. Ha, W. Kim, S.S.Sohn, H.S. Kim, B.J. Lee, N.J. Kim and S. Lee, Dynamic tension-compressionasymmetry of martensitic transformation in austenitic Fe-(0.4,1.0)C-18Mn steelsfor cryogenic applications. Acta Materialia, 2015. 96: p. 37-46.
16. Joo, G. and H. Huh, Rate-dependentisotropic-kinematic hardening model in tension-compression of TRIP and TWIPsteel sheets. International Journal of Mechanical Sciences, 2018. 146: p.432-444.
17. Adler, P.H., G.B. Olson and W.S. Owen,Strain Hardening of Hadfield Manganese Steel. Metallurgical Transactionsa-Physical Metallurgy and Materials Science, 1986. 17(10): p. 1725-1737.
18. Yapici, G.G., I.J. Beyerlein, I. Karamanand C.N. Tome, Tension-compression asymmetry in severely deformed pure copper.Acta Materialia, 2007. 55(14): p. 4603-4613.
19. Lv, C.L., T.M. Liu, D.J. Liu, S. Jiang andW. Zeng, Effect of heat treatment on tension-compression yield asymmetry ofAZ80 magnesium alloy. Materials & Design, 2012. 33: p. 529-533.
20. Park, S.H., J.H. Lee, B.G. Moon and B.S.You, Tension-compression yield asymmetry in as-cast magnesium alloy. Journal ofAlloys and Compounds, 2014. 617: p. 277-280.
21. Pedersen, O.B., L.M. Brown and W.M.Stobbs, The Bauschinger Effect in Copper. Acta Metallurgica, 1981. 29(11): p.1843-1850.
22. Bate, P.S. and D.V. Wilson, Analysis ofthe Bauschinger Effect. Acta Metallurgica, 1986. 34(6): p. 1097-1105.
23. Levine, L.E., M.R. Stoudt, A. Creuziger,T.Q. Phan, R.Q. Xu and M.E. Kassner, Basis for the Bauschinger effect in coppersingle crystals: changes in the long-range internal stress with reversedeformation. Journal of Materials Science, 2019. 54(8): p. 6579-6585.
24. Abel, A. and H. Muir, Bauschinger Effectand Discontinuous Yielding. Philosophical Magazine, 1972. 26(2): p. 489-&.
25. Sowerby, R., D.K. Uko and Y. Tomita,Review of Certain Aspects of the Bauschinger Effect in Metals. MaterialsScience and Engineering, 1979. 41(1): p. 43-58.
Frequently Asked Questions
Is tension/compression asymmetry real?
In the majority of cases the underlying plasticity response is symmetrical, and the perception of asymmetry is largely a myth. Plastic deformation is stimulated by shear stresses, represented by the deviatoric component of the stress state, and for uniaxial loading the von Mises stress has the same positive magnitude whether the applied stress is tensile or compressive. Many reported cases arose entirely from imperfect conversion of raw data to true stress-strain curves.
Why does the hydrostatic stress not affect plasticity?
The hydrostatic or volume-changing component shifts the set of Mohr's circles along the x-axis without altering the peak shear stress, which is given by half the difference between the largest and smallest principal stresses. This is consistent with the fact that plasticity involves no change in volume. Neglecting the hydrostatic component in an analysis of plasticity characteristics is usually an acceptable assumption.
Can compression testing replace tensile testing?
It can, and specimens can be simpler in shape and smaller because there is no gripping requirement. Comparison of true curves from tensile and compressive tests on as-received and annealed copper shows a large measure of agreement, confirming that the same underlying plasticity characteristics come from both. Compression is more susceptible to variables that are difficult to pin down accurately than tensile testing is.
What causes barrelling in a compression test?
Friction at the sample/platen interface, which is difficult to eliminate, leads to the development of a barrel shape in an initially cylindrical sample, and it is very common in practice. Measuring the diameter at the top and bottom of the sample at the end of the test and comparing it with the initial diameter shows whether interfacial sliding has occurred. Frictional effects can make the strain field highly inhomogeneous.
How is the friction coefficient measured in compression testing?
If the true stress-strain relationship is known, FEM simulation of the compression test can characterise the friction conditions through an inverse iterative modelling sequence, the same type of methodology used in PIP testing to obtain a stress-strain relationship. The barrelled shape serves as the experimental outcome that guides the evaluation. In work carried out at high temperature, the best-fit value was about 0.375.
What friction coefficients are typical?
A value in the approximate range 0.1 to 0.3 has often been found appropriate for unlubricated compression, though there may be a dependence on surface finish and materials. Lubricated testing shows more variation, with values of the order of 0.05 to 0.1 typical where lubrication is good. Accurate estimation is difficult and the value may change during the process.
When is genuine tension/compression asymmetry expected?
For porous materials, taken as those with porosity above a few per cent, since pores close under compressive hydrostatic stress and open under tensile stress. Asymmetry is also expected where plasticity is accompanied by a phase transformation with an associated volume change, which is why some reports relate to shape memory alloys, TRIP steels and Dual Phase steels. Genuine asymmetry of this type is possible but quite rare.
Does Hadfield's Manganese steel show real asymmetry?
True stress-strain plots from tensile and compressive tests suggest at least some asymmetry, with the material appearing harder in compression. Caveats apply: the tensile plots were unaffected by necking and should be accurate, but the paper gives no reference to lubrication or assessment of friction, so the higher compressive flow stress may be largely attributable to frictional effects. Some genuine asymmetry from the phase transformation contribution is possible, though probably small.
What is the Bauschinger effect?
Johann Bauschinger identified it in 1881, observing that a sample deformed plastically in tension then tested in compression had a lower yield stress than it had shown in tension. It occurs in single crystals as well as polycrystalline samples, and is often investigated via cyclic tests with repeated reversal of the loading. It can be regarded more broadly than a dependence of flow stress on prior reverse loading, since any plasticity characteristic may depend on prior strain history, potentially creating anisotropy.
How does the Bauschinger effect differ from tension/compression asymmetry?
Asymmetry concerns different samples of the same material tested in the two directions, whereas the Bauschinger effect concerns something that happened during a first test affecting the response in a second. Some reports of asymmetry may in fact reflect confusion with the Bauschinger effect.
What explains the Bauschinger effect?
The main proposed mechanisms rest on either the generation of residual stresses or dislocation mobility, with the concept of a back-stress central to both. A simple uniaxial test with uniform fields should not create residual stresses, so any residual-stress explanation requires local stresses that facilitate reverse plasticity. The most plausible explanation is that dislocations encounter obstacles and tangles when moving in one direction and find it easier, at least initially, to move in reverse.

Bill was Chief Scientific Officer atPlastometrex (now retired) and Emeritus Fellow in the Mechanics of Materials atthe University of Cambridge, where he served as Professor of the Mechanics ofMaterials. A Fellow of the Royal Academy of Engineering, his research spans thethermo-mechanical behaviour of composites and surface coatings, with a focus onprocess simulation and numerical modelling of material performance. His work onindentation techniques and residual stress measurement underpins much of thePIP methodology now commercialised by Plastometrex.