The dimensions of the region being plastically deformed determine whether a mechanical test tells you anything about the bulk material. This guide covers how metals deform plastically through dislocation glide, why a representative volume needs a large assembly of grains, and how sample dimensions distort conventional tensile results, including elongation at failure and reduction of area. It then examines the size effects that undermine nanoindentation and micro-pillar compression, and explains how indentation plastometry is designed around scale effects to test a multi-grain volume.
Effects of sample size and shape in plasticity testing
For any test procedure aimed at obtaining plastic deformation characteristics (of a metal), the dimensions of the sample (or rather of the part of the sample that is being plastically deformed) are important. Recent decades have seen the development of procedures that mechanically deform only very small volumes. These include “nanoindentation”and “micro-pillar compression”. For elastic properties, such as stiffness, this may be acceptable, since they largely depend just on the types of atom present, which is likely to be similar in a very small region and in the bulk. The plasticity characteristics, however, depend in a complex and sensitive manner on the “microstructure” – a term that encompasses many features (on a range of length scales). Not only are these effects complex, but the outcome (in terms of plasticity response) can only be captured if the region being deformed plastically is large enough to be representative of the bulk. This usually translates into a requirement for a relatively large number of grains to be present. If the sample (or the region being tested) is a single crystal, then the situation is different, but is complicated by the fact that they are(elastically and plastically) anisotropic. In addition to these issues, there are size effects that relate to the constraint being imposed on how the region is able to deform (plastically). These also can lead to incorrect results if the tested region is small. These issues need to be carefully considered if meaningful results are to be obtained: some of them relate to conventional testing, as well as to novel (fine scale) procedures.
How do metals deform plastically under mechanical load?
Elastic deformation of metals arises from changes in inter-atomic spacings under load. Plastic deformation, however, requires a new configuration of the atoms.
This happens primarily via slipping of atomic planes over each other (in an ordered, crystalline structure - all metals are normally crystalline). This does not occur in a single operation. Instead, line defects (“dislocations”) move across the plane, generating this slippage. This is analogous to a carpet being moved across a floor, not by dragging the whole thing, but by propagating a small “ruck” in it. As with a carpet, this can be done repeatedly to create quite large displacements between the regions above and below the plane. In fact, dislocations do have a tendency to follow one another across a particular plane (driven by an applied stress). Dislocations move under the influence of a shear stress acting on the plane. For a particular material, a critical level is needed (the lattice friction stress, or Peierls stress), although, after a lot of dislocation motion, they start interfering with each other so as to limit their mobility, leading to “work hardening”.
Dislocations “glide” in this way only on certain types of plane - usually those in which the atoms are most closely packed - and in certain directions within the plane - usually the closest-packed directions. If the sample is a single crystal - relatively unusual for a metal - then, initially at least, dislocations glide only on the plane, and in the direction, in which the largest shear stress operates. They tend to follow each other across sets of parallel planes, reaching the free surface, where they create “steps”. These are sometimes described as“persistent slip bands”.
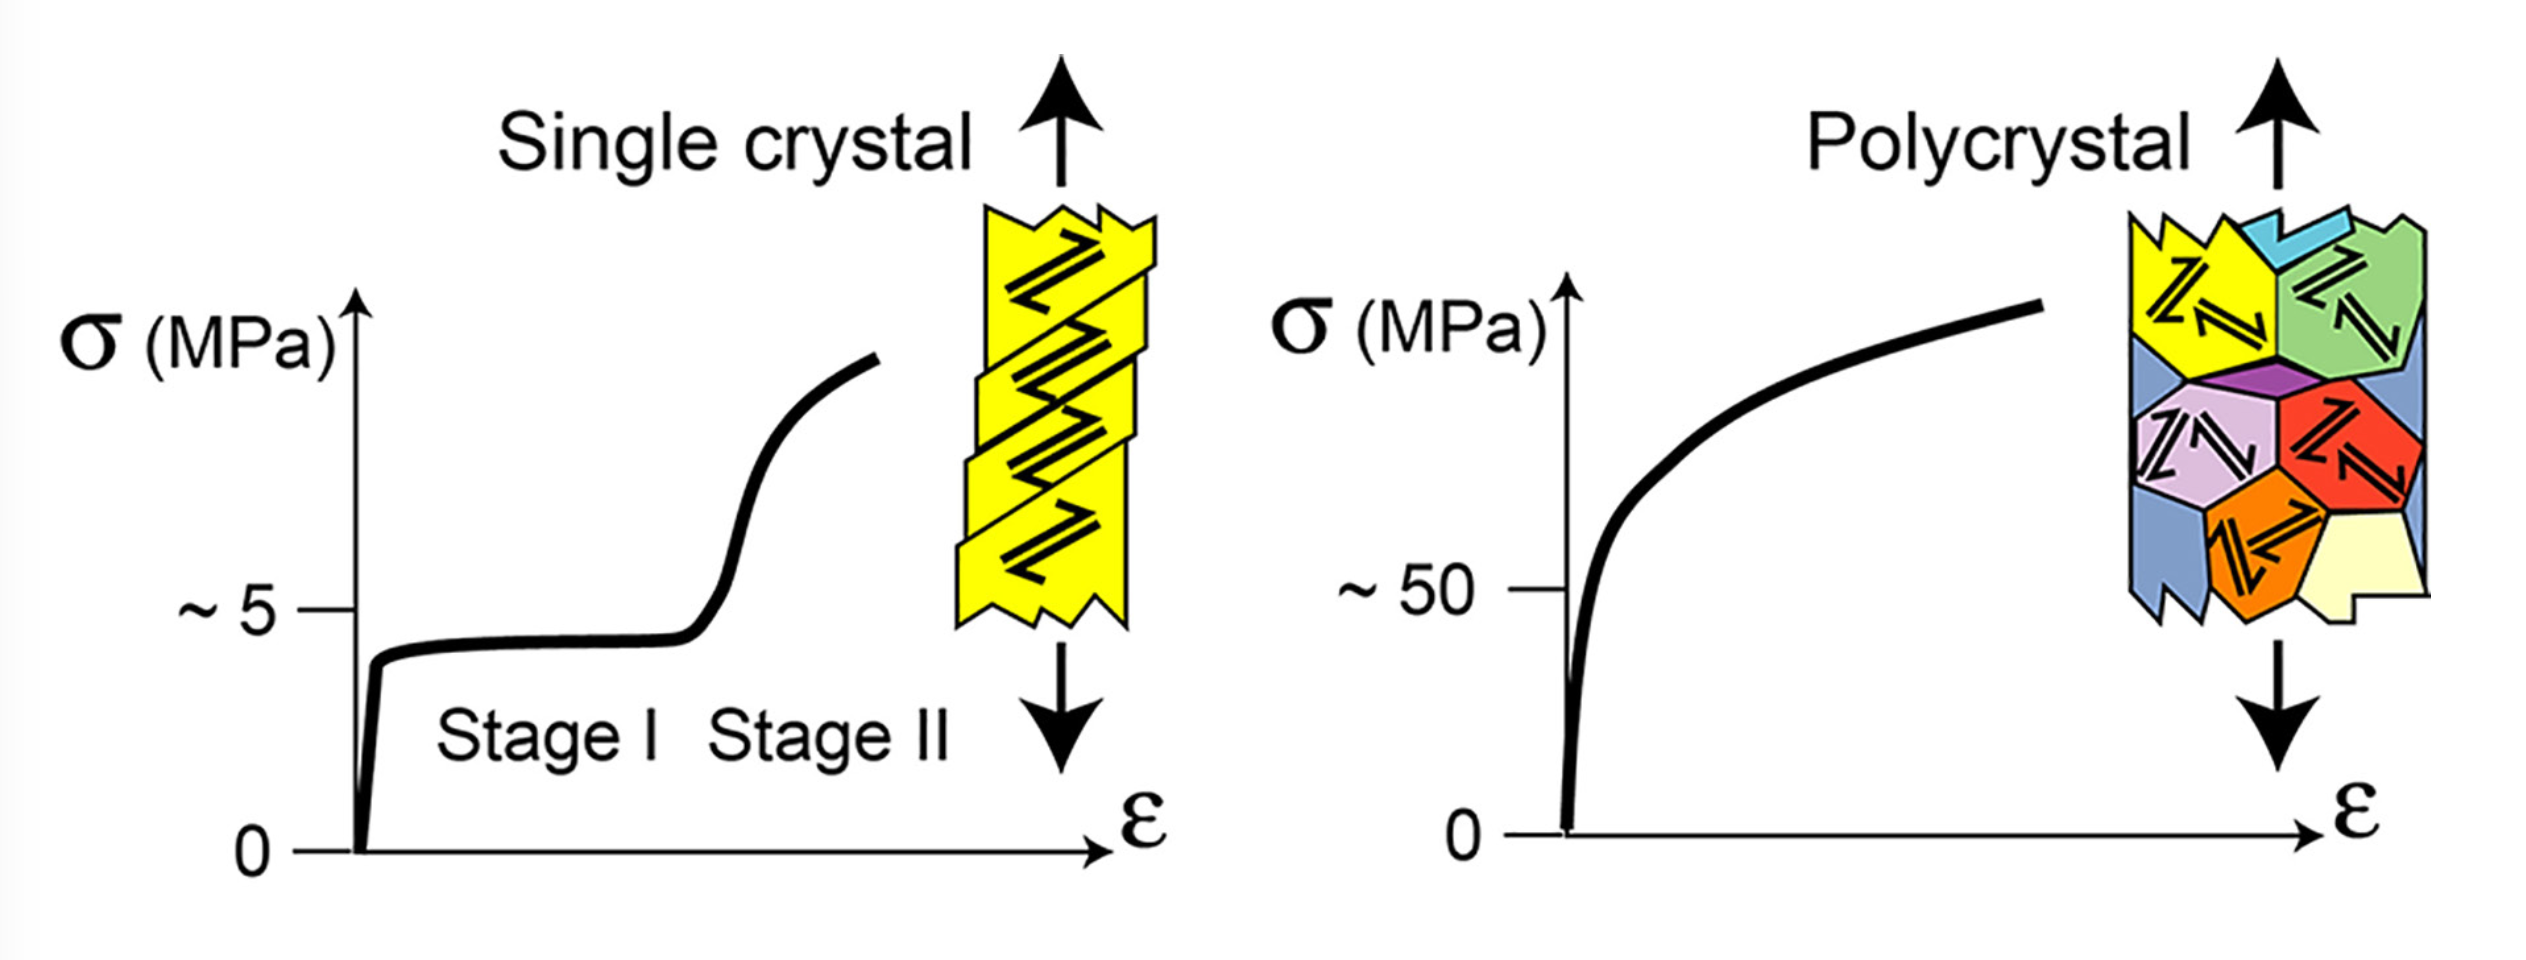
After this process has created a certain amount of strain (during a regime described as “easy glide” or Stage I), the crystal effectively becomes reoriented with respect to the tensile axis, such that it becomes favourable for sliding to start on other planes, leading to“multiple slip”. Dislocations then start to cut through each other on intersecting slip planes, disrupting their structure and making them less mobile. During this “Stage II” of the test, the stress needed for continued straining thus starts to rise. The behaviour will be somewhat different if the orientation of the crystal, with respect to the tensile axis, is changed. For example, the “yield stress” for onset of plasticity will be (a little)different.
However, metallic single crystals are unusual. Most components and samples contain large numbers of crystals (“grains”). In fact, since a typical grain size might be ~100 µm, a typical sample (with linear dimensions of a few cm) contains millions of grains. Such materials deform plastically in a quite different way from (the corresponding) single crystals. This is illustrated on the right hand side of Fig.1. From the start, the deformation of each individual grain has to be compatible with that of its neighbours – ie there is a strong constraint effect. To satisfy this, slip is required from the start on more than one plane in virtually all grains and substantially higher stresses are needed for yielding and plasticity, compared with single crystals. Also, the stress-strain curve shows no stages like those observed initially with a single crystal.
How does microstructure affect the plasticity of a metal?
The plasticity characteristics of a polycrystal depend in a complex and sensitive manner on what is usually called the “microstructure”. This term incorporates the crystal structure of the phases present, the grain size and shape, the texture (orientation distribution of the grains), the alloy composition, the grain boundary structure, the initial dislocation density, the impurity levels etc. Bulk properties will only be reflected in a test if the tested volume is large enough to capture the sensitivities to all of the microstructural features, which cover a large range of scales. The concept of a “representative volume” is an important one. In particular, only a relatively large assembly of grains is likely to satisfy this requirement. If, for example, the section of a small sample contains only single grains, or a handful of grains, then its response is likely to differ significantly from that of the bulk.
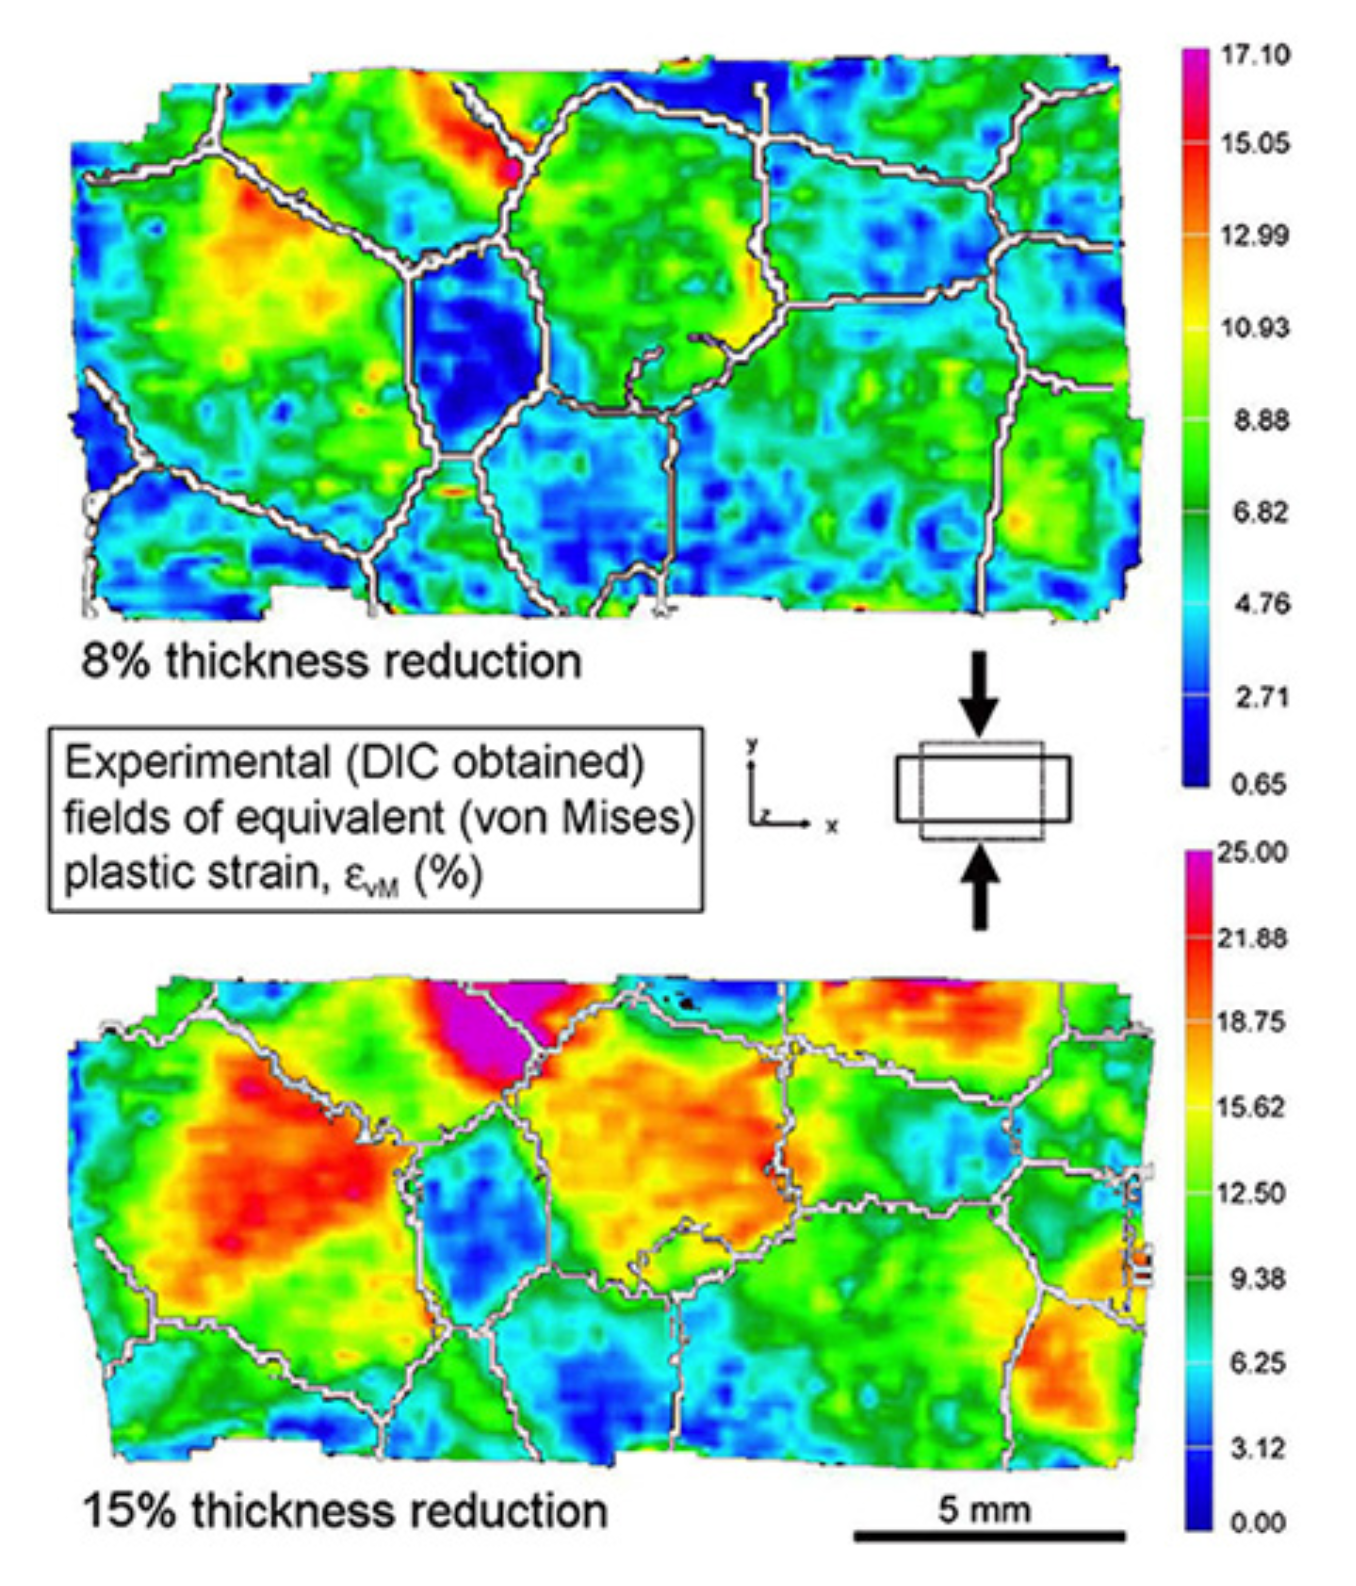
There are several ways of highlighting this issue. One is shown in Fig.2, which presents experimental information [1] obtained on a (coarse-grained) Al sample after two different degrees of plastic deformation. These images are maps of equivalent plastic strain, obtained using the digital image correlation (DIC) technique. They highlight the inhomogeneous nature of the deformation, with some grains deforming much more than others.There are also marked variations within individual grains. Moreover, it can be seen that substantial changes take place in the morphologies of the grain boundaries: their local structure is likely to influence the way in which this occurs. It's clear that the overall (plastic) response of the material can only be well captured if an assembly of grains (with a representative texture, set of grain boundaries etc) is being deformed.
Do sample dimensions matter for conventional testing?
It should first be appreciated that, even fora conventional tensile test, the dimensions of the sample can affect the outcome (even if the tested region - the gauge length - is large enough to be“representative”). This particularly relates to the “post-necking” regime.Necking occurs when the rate of work hardening, which tends to drop off with increasing strain, becomes too low to inhibit the formation of an unstable region in which the (true) stress rises rapidly as the sectional area decreases. Necking starts at the peak in the (nominal) stress-strain curve, as illustrated in Fig.3.
After necking, the stress and strain fields in the gauge length become highly inhomogeneous - see Fig.3(b). The “ductility”(or “failure strain”, or “elongation at failure”), which is often taken to be the nominal strain when fracture occurs, is usually well beyond the onset of necking. It does not correspond to the true strain in the neck when fracture occurs, which is usually much higher. In fact, the values quoted have little or no real significance, despite their widespread usage.
This point is illustrated by the plots [2] in Fig.4, which relate to a single material that was tensile tested with a range of values for the gauge length and the diameter of the (circular) gauge section. While the behaviour is similar for all samples up to the point of necking (peak in the plot), which is ~6-8% for this material, the elongation to failure values cover a huge range, being larger for the samples with shorter gauge length and, with a given gauge length, for those with larger diameter.
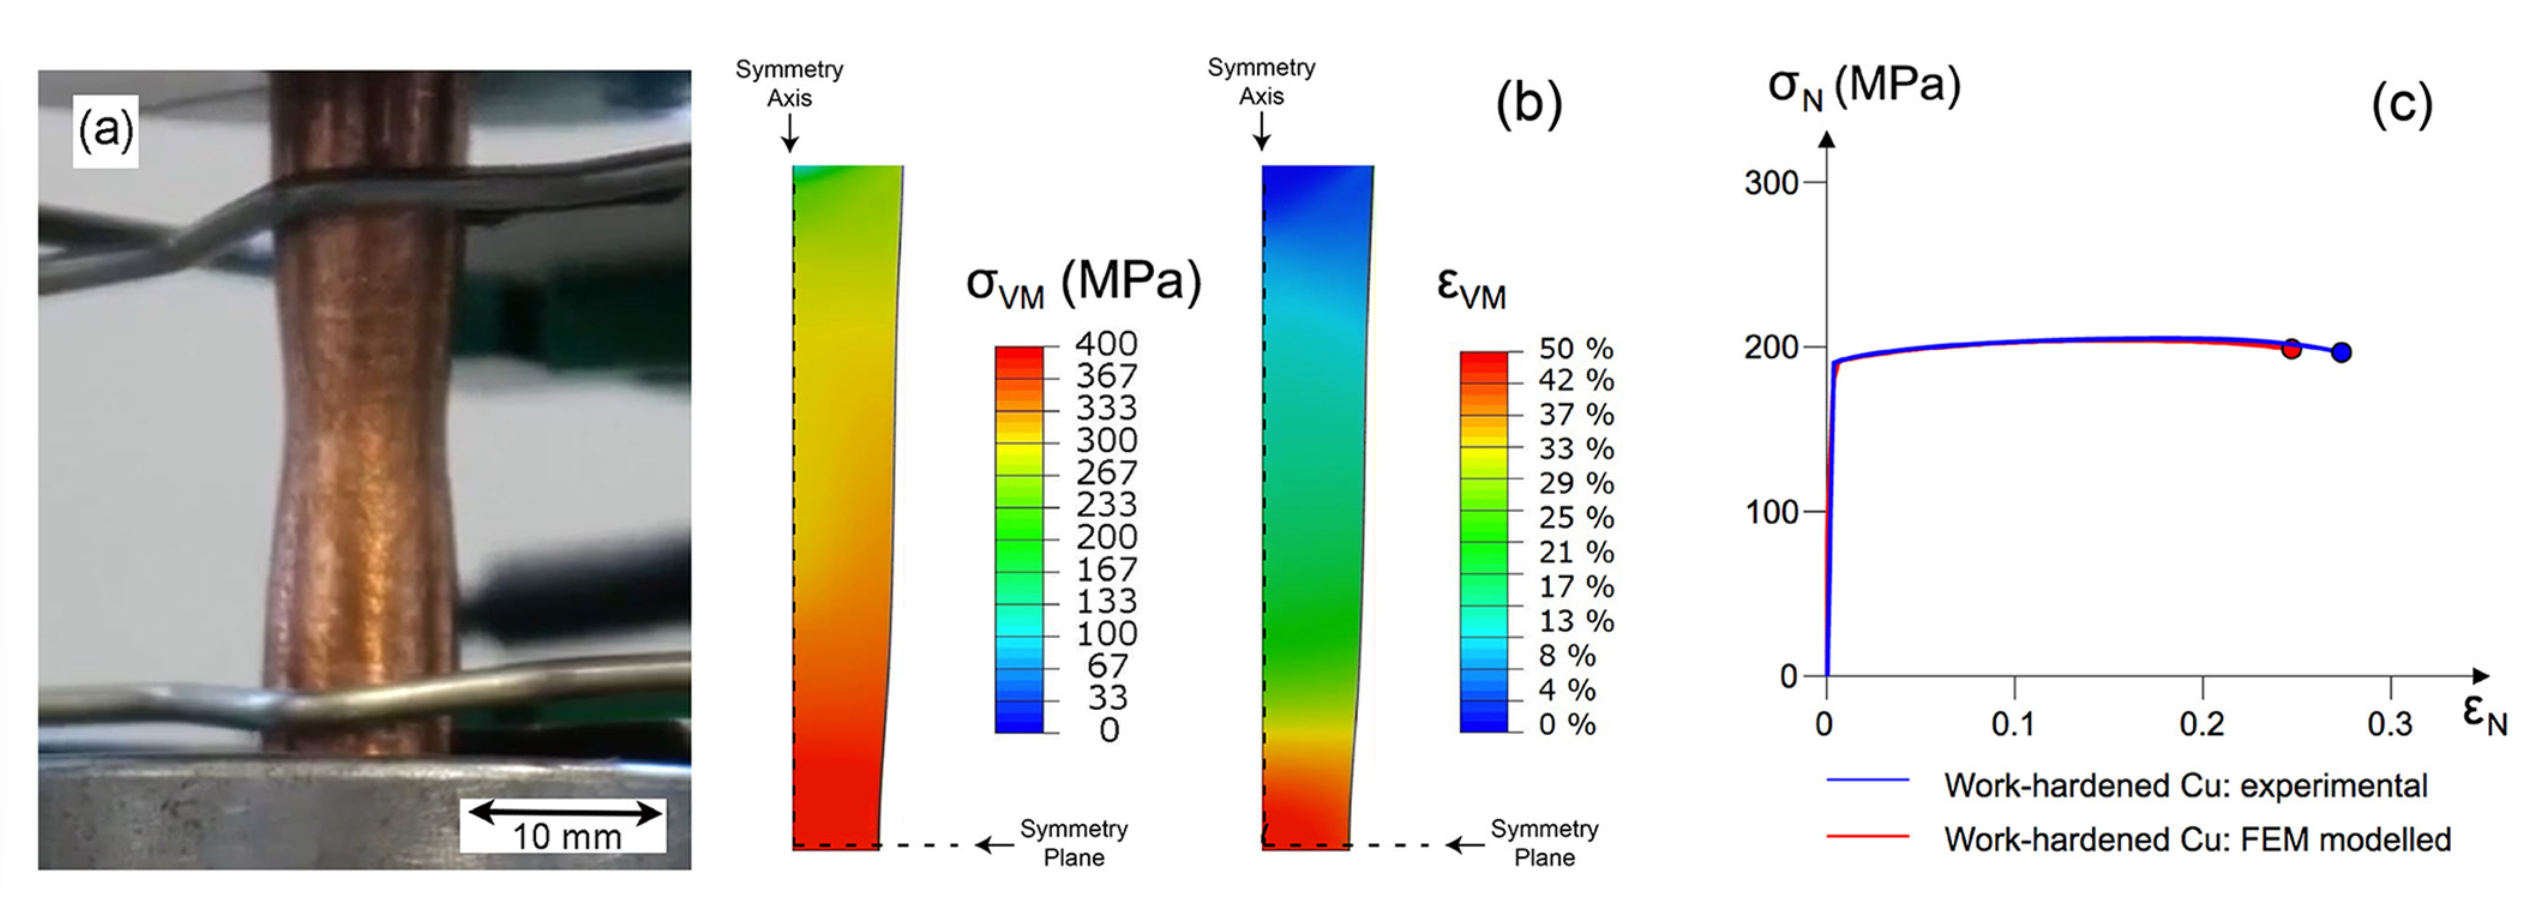
The cause of this is simple. After the peak, with necking taking place, virtually all of the recorded elongation is due to straining in the neck. For shorter samples, this region constitutes a greater proportion of the gauge length, making the increase in (nominal) “strain”larger. Similarly, with a larger diameter, the contribution from necking is increased (for a given gauge length). This effect can be clearly captured in anFEM model, as shown in Fig.4. Provided the (true) stress-strain relationship is valid up to the high strains involved, and a suitable fracture criterion can be identified - a true plastic strain of 100% was used in the plots shown, then the complete (nominal) stress-strain curve, including the post-necking region, can be reliably predicted.
Of course, such modelling is not routinely undertaken and these features highlight the fact that, certainly in an absolute sense, “ductility” values are virtually meaningless. The actual (true) strain in the neck at the point of fracture bears little or no relation to the raw number obtained from the nominal stress-strain curve - the true strain in the neck is usually much higher. Also, the true stress at the point of fracture is far higher than the apparent value according to the plot. The load often drops while the neck develops, but the sectional area in the neck is also dropping (more sharply), so the true stress is rising.
Another parameter often extracted from a tensile test is the so-called “Reduction of Area” (RA). This is the decrease in sectional area at the neck (usually obtained by measurement of the diameter atone or both of the fractured ends), divided by the original sectional area. It is sometimes stated that this is a more reliable indicator of the “ductility”than the elongation at failure (partly in recognition of the fact that the latter is dependent on the aspect ratio of the gauge length, although this dependence is far from being universally acknowledged). There is something in this argument, but the RA is still some way from being a genuinely meaningful parameter. One objection is that it is not easy to measure accurately, particularly with samples that are not circular in section. Rather more fundamentally, it is affected by both the uniform plastic deformation that took place before necking and by the development of the neck. Furthermore, it is sensitive to exactly what happens in the latter stages of necking, when the true strain is often becoming very high and the behaviour is of limited significance in terms of a meaningful definition of strength (or toughness).
In summary, the yield stress and the work hardening characteristics up to necking are valid outcomes, as is the UltimateTensile Strength (UTS) - commonly the stress at the peak of a nominal stress-strain curve. However, the numbers obtained for the elongation at failure and the reduction in area are more or less meaningless. They are dependent on sample dimensions, but not in a way that can be interpreted to obtain meaningful information. There is an argument for abandoning them entirely and concentrating on parameters that provide useful guidelines for assessment of the “strength” of a metal.
Plasticity parameters from fine (nano) scale tests?
Before considering very fine scale testing procedures, it may be noted that the issues raised in §1 about a“representative” volume can be relevant even if the scale is not ultrafine. Fig.5 shows UTS data [3] from pure Cu samples of rectangular sectional shape(gauge length of 4 mm and width of 2 mm). Two types of material were produced, one by electron beam melting and annealing (giving a relatively coarse grain size of ~80 µm) and the other by friction stir processing (giving a finer grain size of just over 10 µm). Sample thicknesses were varied by grinding and polishing, giving a maximum thickness of 2 mm for the coarse-grained material and 0.5 mm for the fine-grained one. These UTS values are clearly sensitive to sample dimensions, being lower for those with reduced thickness (as a ratio to the grain size). This is due to the reduced constraint imposed on the way that the deformation takes place in the thin samples.
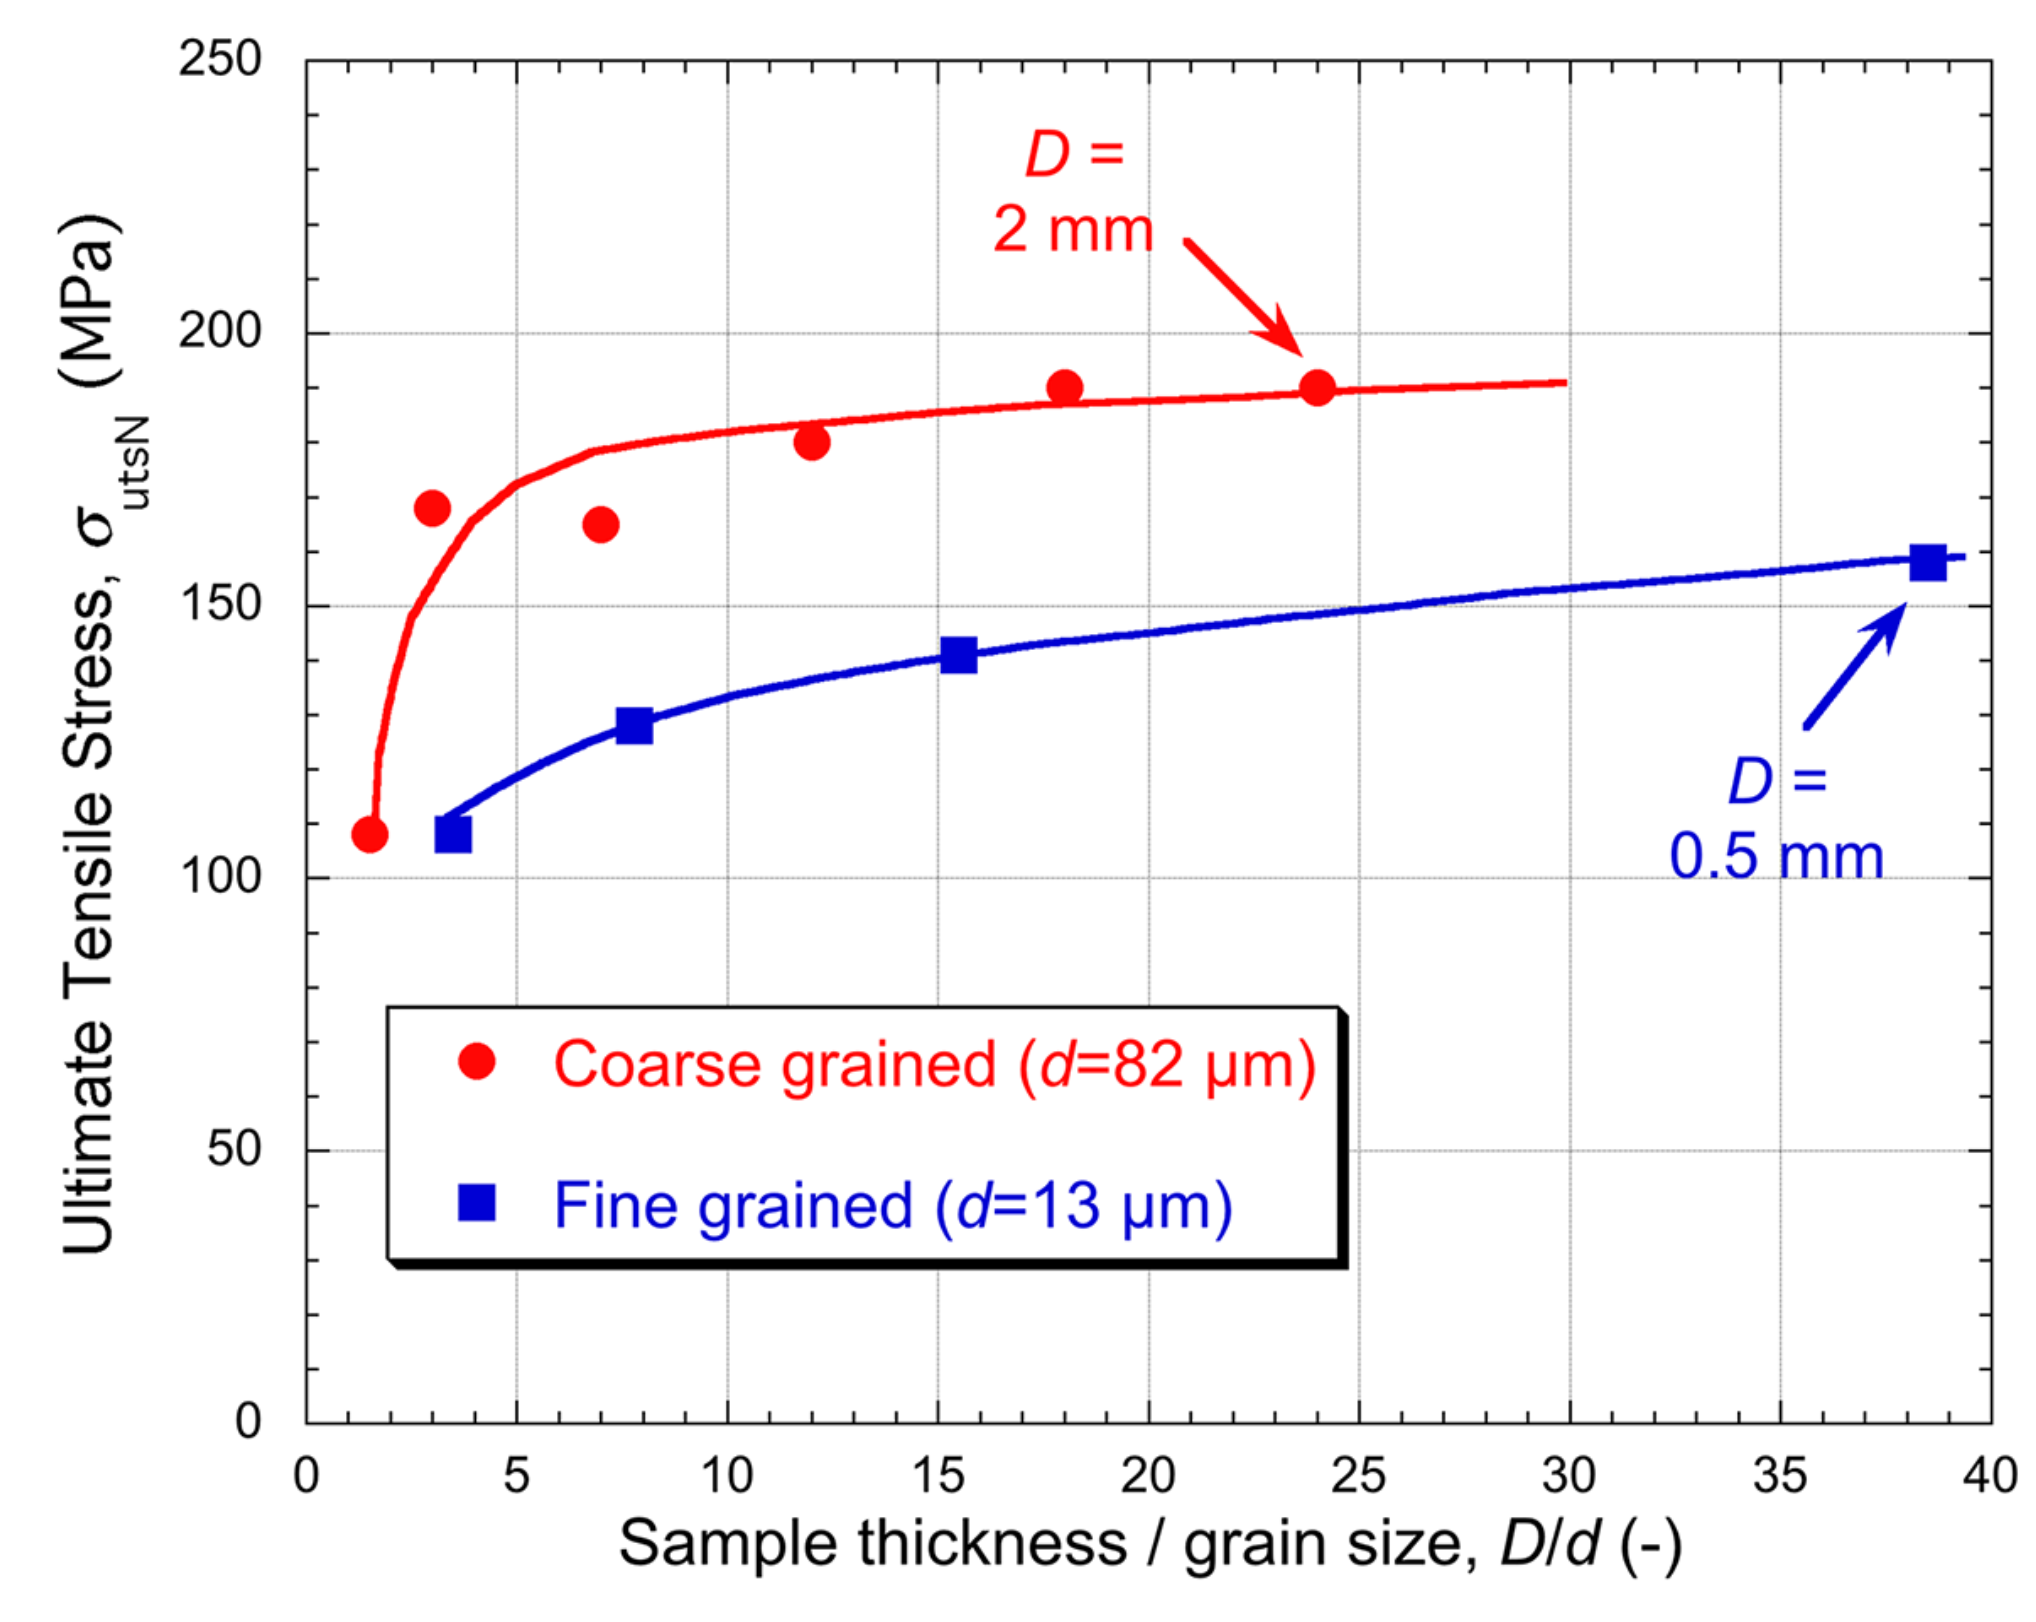
Furthermore, since the minimum ratio required to give “correct” values (independent of this ratio) is higher for the finer-grained material, there is apparently also an absolute size effect, as well as one expressed in terms of the ratio. This is certainly plausible, since constraint reduction effects will operate near to a free surface even if there are many grains across the section. It can thus be concluded that unreliable results are likely to be obtained if there are only a few grains across the section of the sample (even if it is only in one direction) and also if a significant proportion of the section is close enough to a free surface for constraint effects to be relaxed. This casts doubt on a lot of published data.
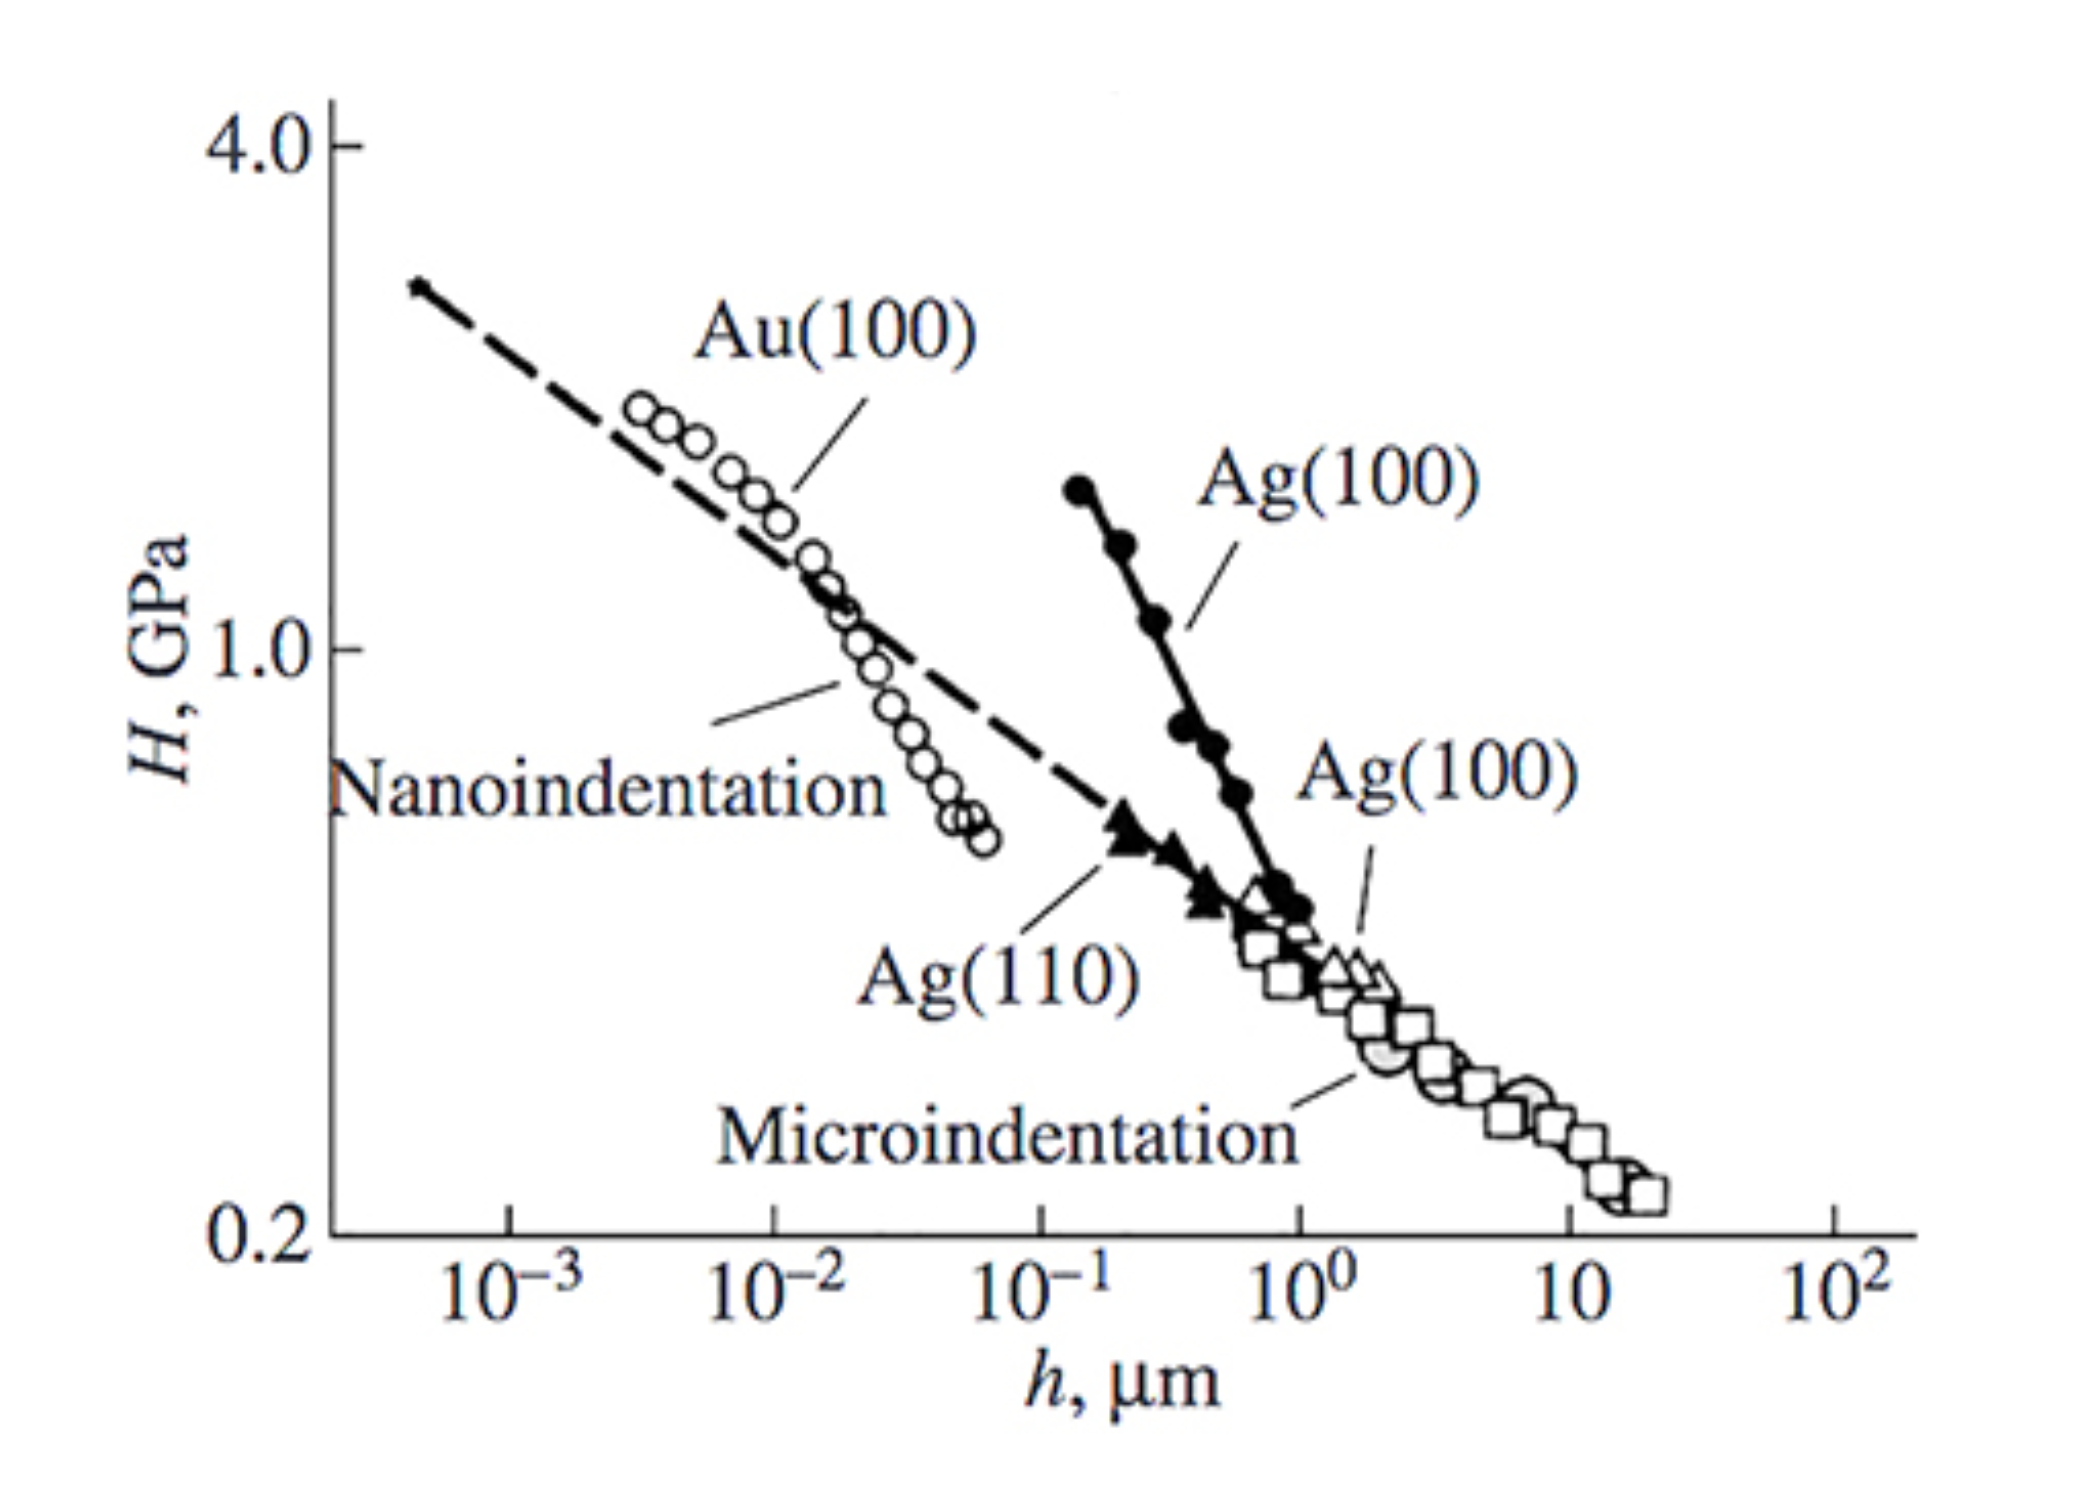
Moreover, the danger of obtaining misleading plasticity-related information becomes much worse when considering genuinely fine scale tests, such as those commonly referred to as “nanoindentation” and“micro-pillar compression”. The volumes being deformed in these cases have dimensions in the µm or nm range and hence usually comprise single crystals.They cannot be “representative” of corresponding bulk material. Furthermore, plasticity-related properties obtained via nanoindentation load-displacement plots tend to vary with the size of the indent. In general, there is a clear tendency for the material to appear to become harder as the scale of the indentation is reduced. This is often referred to simply as a “size effect” [4-6]. The easiest parameter to obtain, although not really a “genuine” property, is the hardness number, H (usually defined as the load over the contact area - see thePlastometrex article on hardness published in May 2020). The kind of effect that is commonly observed is illustrated [5] by Fig.6, which gives measured hardness values, as a function of penetration depth, for single crystals of silver and gold. Although obtained by several different researchers, these data should be free of extraneous variations, since they all refer to high purity single crystals with defined orientations. Moreover, these metals should be free of significant surface oxide - certainly the gold (which forms no oxide)and probably the silver (since the Ag data refer to deeper indents).
These data - for example, a rise from ~0.5 GPa to ~2 GPa as the indent depth is reduced from ~100 nm to ~5 nm for the Au - are clearly “scale-affected”. In fact, even 0.5 GPa is a major overestimate compared with the “correct” bulk value for gold. (This should probably be below0.1 GPa, based on a “rule of thumb” that the Vickers hardness is about 3σY(Hardness article) and the yield stress of a single crystal of pure gold is certainly no greater than a few tens of MPa.) Similar trends are observed for most materials, often being highly significant over the range of common nanoindent sizes. Plasticity-related properties thus obtained are certainly “incorrect” in the sense that they do not reflect an inherent (scale-independent)characteristic of the material being tested.
Various explanations for the size effect have been proposed, many based on dislocation-related phenomena. For example, the concept has frequently been invoked [7-10] of a high gradient of plastic strain being associated with (fine scale) indentation, bringing a requirement for“geometrically-necessary dislocations”, which can only be created if the stress is raised. However, despite many attempts at theoretical justification, it is difficult to imagine such “forest hardening” mechanisms operating in the very small volumes concerned, or causing the very large size effects that are commonly observed.
A different dislocation-related mechanism concerns the possibility that the deformed volume initially contains no dislocations, creating a requirement for a higher stress to nucleate them and initiate plastic deformation. This would be needed to create new dislocations, either internally or at a free surface. This is plausible, since the dislocation density, ρ, in a metal may be as low as ~1010 m-2, giving an average distance between dislocations of ~10 µm (~ 1/√ρ). For an indent depth of, say, a few tens of nm, the volume being plastically deformed will be below a few cubic microns, and hence could be free of dislocations initially.Supporting the “dislocation nucleation” argument are observations in load-displacement plots of what is often termed a “pop-in” phenomenon - that is, a burst of straining while the load remains unchanged [11-15]. This is expected if there is a barrier to the creation of dislocations, but they are readily able to glide once they are formed. This effect probably occurs, although exactly what effect it has on a derived hardness (or yield stress)value will depend on how the data are processed.
In fact, pop-in features may in some cases be due to effects not associated with dislocations. For example, (martensitic)phase transformations stimulated by the applied load can create similar effects[16]. Moreover, while this is rarely identified specifically as a cause of pop-in, it may in some cases be due to some kind of break-through of a surface oxide film or other extraneous layer. Native oxide films on metals are generally quite thin (sub-micron and often only a few nm), but they are usually much harder than the metal and, when indentation is only being carried out to a depth of a few tens of nm, their rupture may cause a noticeable burst in a load-displacement plot. While attempts to quantify such an effect are rare, it has been recognised [17] that pop-in effects are sensitive to the details of how near-surface region are prepared. In any event, such effects can create further complications when attempting to characterise the real mechanical characteristics of a sample.
In summary, while the size effect certainly means that plasticity-related characteristics obtained via nanoindentation are unlikely to be reliable indicators of anything inherent in the material under test, the explanation for it remains unclear. Possibly it arises from more than one mechanism, and in different combinations in individual tests.
It should perhaps also be mentioned that it could be at least partly due to what might be termed “constraint” effects, of the type described in §1. During nanoindentation, deformation of the region being tested is constrained by it being bonded to surrounding regions that remain rigid, or at least elastic. The nature and strength of such effects will vary with the indenter geometry and material properties, but they will certainly tend to become more significant as the volume of the region being tested becomes smaller. This is complex geometrically, and also not well-suited to treatment of the region as an isotropic continuum, so it is far from easy to analyse or validate, and indeed this has rarely been attempted. Overall,“correcting” in a well-defined way for the size effect is not really viable at present, and indeed it looks likely to remain a rather intractable problem.
Another popular type of fine scale test is “micro-pillar compression”, which is often carried out with similar equipment to that used for nanoindentation. This limits the dimensions of samples. Taking the maximum load to be ~1 N (a relatively high value), then, if samples with yield stress levels of up to, say, 500 MPa are to be deformed plastically, then the maximum sample diameter is about 50 µm. In practice, micro-pillars of up to around this diameter are tested, but most are smaller. This also limits the sample length, since the aspect ratio must be below about 2 or 3 if buckling is to be avoided. Samples with such dimensions clearly cannot be handled in the same way as for conventional compression testing. The region to be tested must somehow be secured at the base and held vertical. In practice, this can only be done via some sort of machining of the sample in situ, leaving the base integral with the substrate.
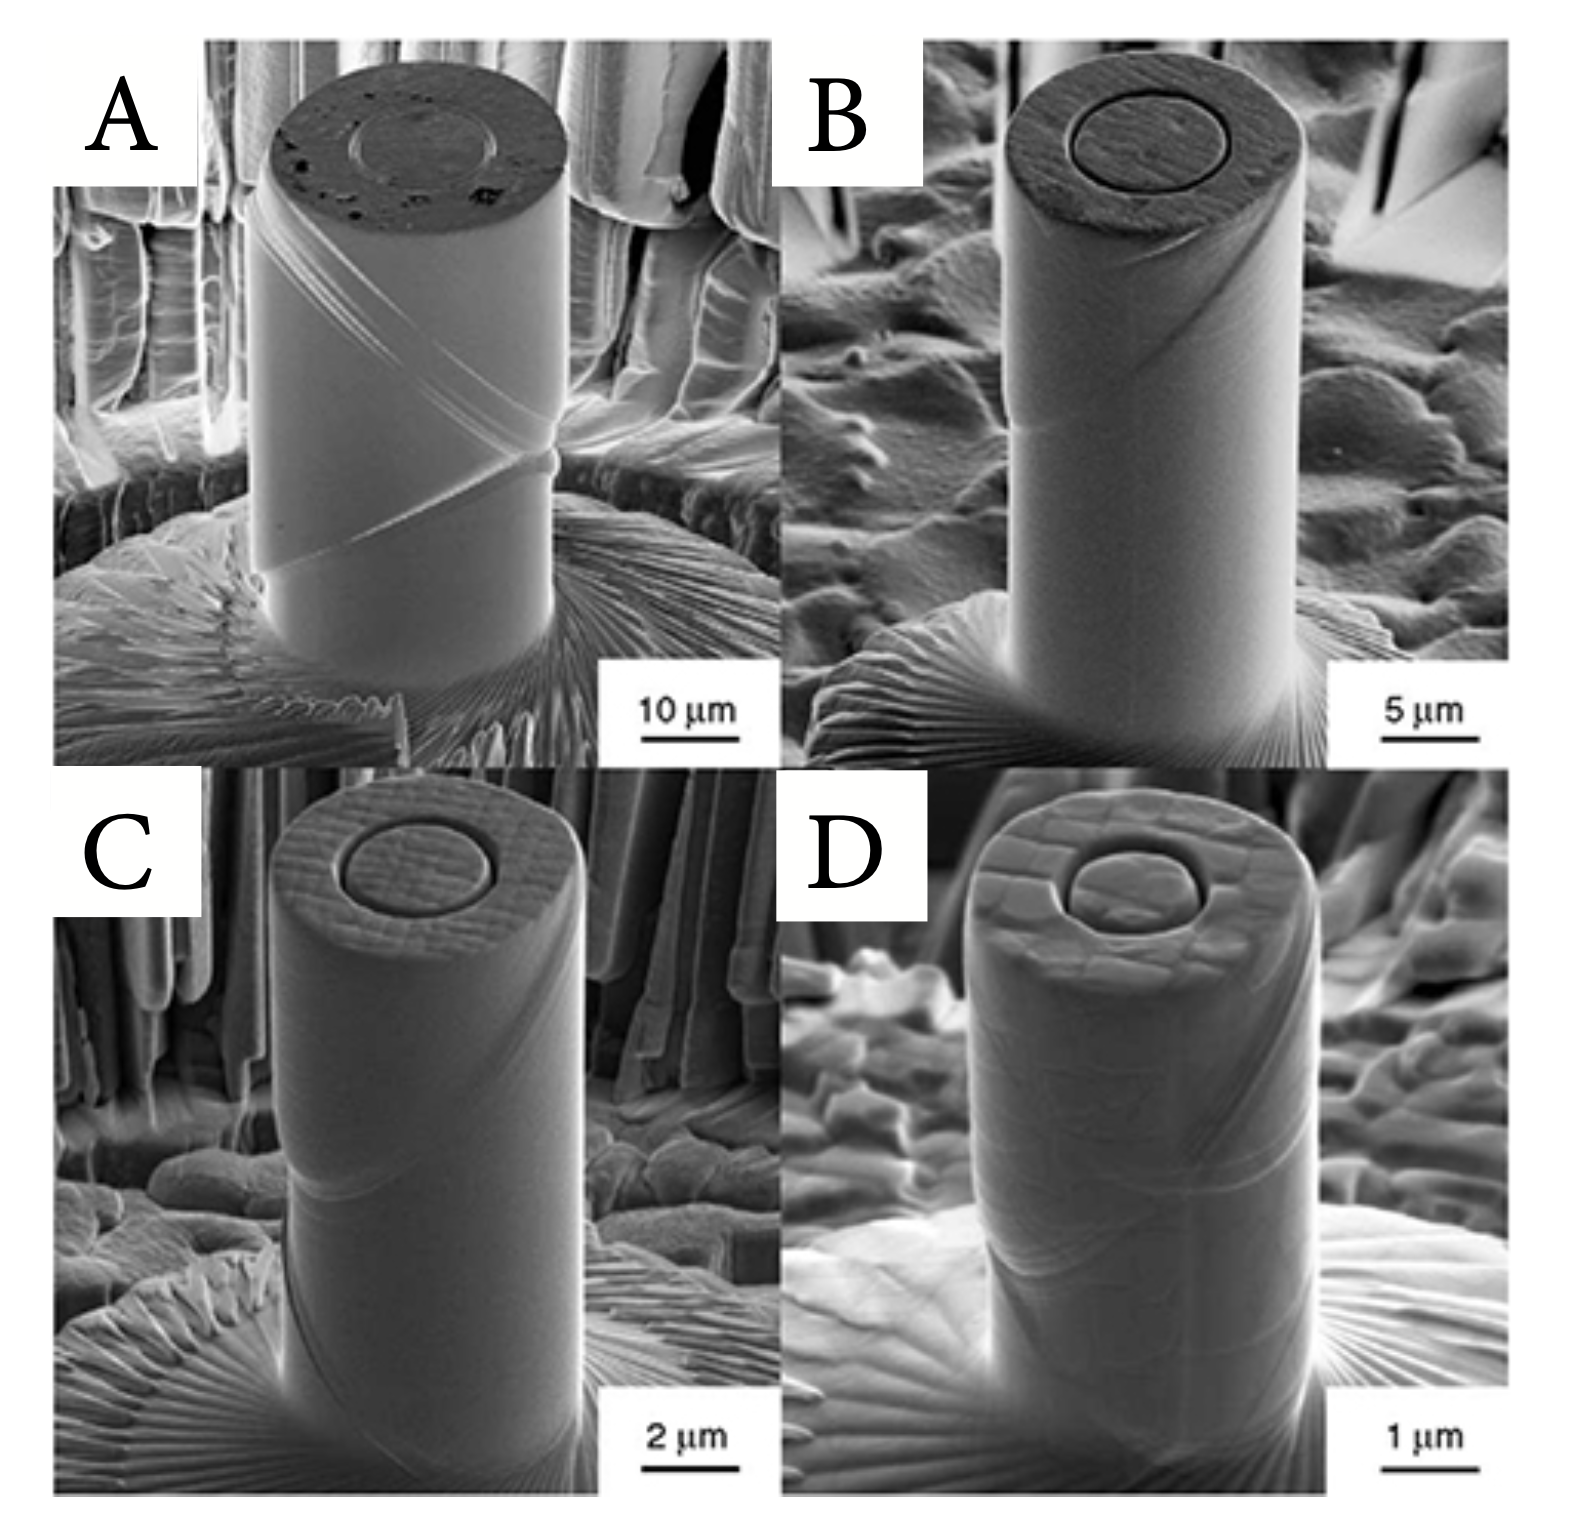
Examples [18] of samples after testing are shown in Fig.7. These were all milled from the same superalloy substrate, the only difference between them being one of size (diameter). The same primary slip system (§1) came into operation first for each sample. For samples(B)-(D), which were subjected to relatively low strains of ~2-4%, only this slip system operated, as in the schematic depiction of Fig.1. For sample (A),however, which was strained to over 8%, it can be seen that a second slip system came into operation.
One would hope that stress-strain curves from such tests would correspond to those from conventional compressive tests on the same single crystal (in the same orientation). In reality, the outcomes [18]are usually very different, with a clear tendency for the apparent yield stress to be higher for smaller samples, and for them all to be well above that from conventional testing. This is clearly a concern, since the main objective is to study basic plasticity characteristics of small regions, with the added attraction of a potential for viewing features such as individual persistent slip bands on the surface, which is normally difficult during conventional testing - although this can be done after indentation plastometry - see §5below.
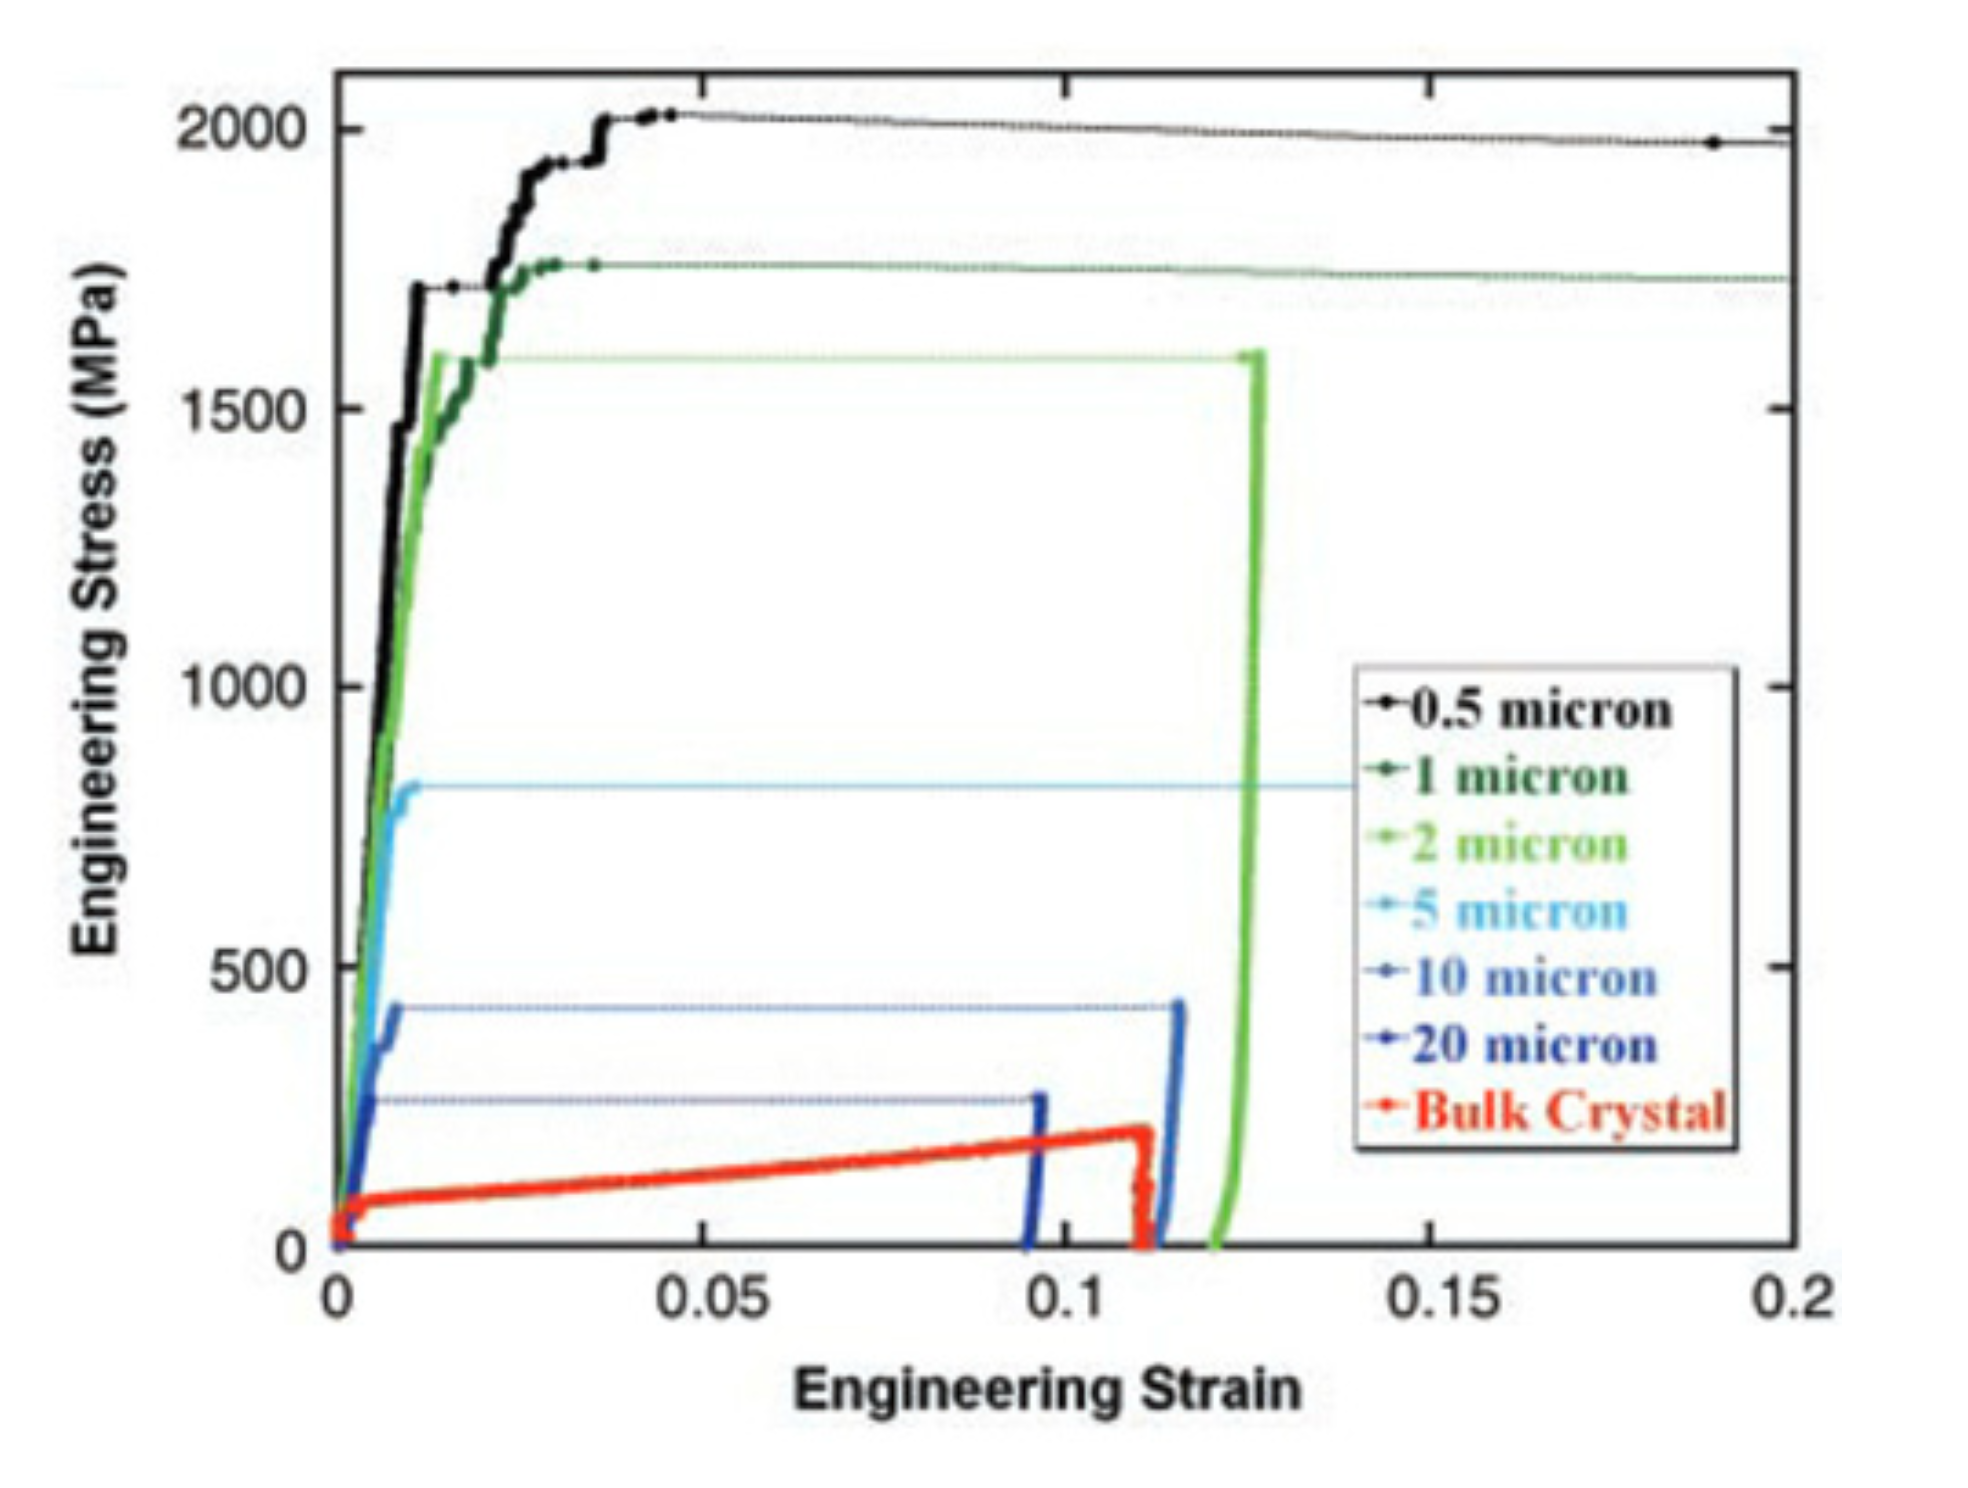
These size effects tend to cover a smaller range than those typically observed during nanoindentation, although the size range itself is usually also smaller. Some typical data [19] are shown inFig.8, where a clear trend is apparent. Several reviews [20-23] are available covering this issue. In general, similar explanations to those invoked for nanoindentation are put forward, including strain gradient arguments and dislocation nucleation barriers. The “constraint” argument (which is rarely expressed in either case using that term) cannot operate in the same way, since most of the sample is clearly unconstrained. On the other hand, the fact that the tested region is continuous with the substrate at its base clearly exerts a significant constraint on the deformation.
A general conclusion regarding this type of testing has to be that, while outcomes may be interesting, and attractive images are sometimes created, it suffers from similar drawbacks to nanoindentation in the sense that, as a consequence of various extraneous effects that are difficult to quantify, it cannot be used to obtain reliable, or even meaningful, information about the real plasticity characteristics of the region being tested.
Are there size effects in indentation plastometry?
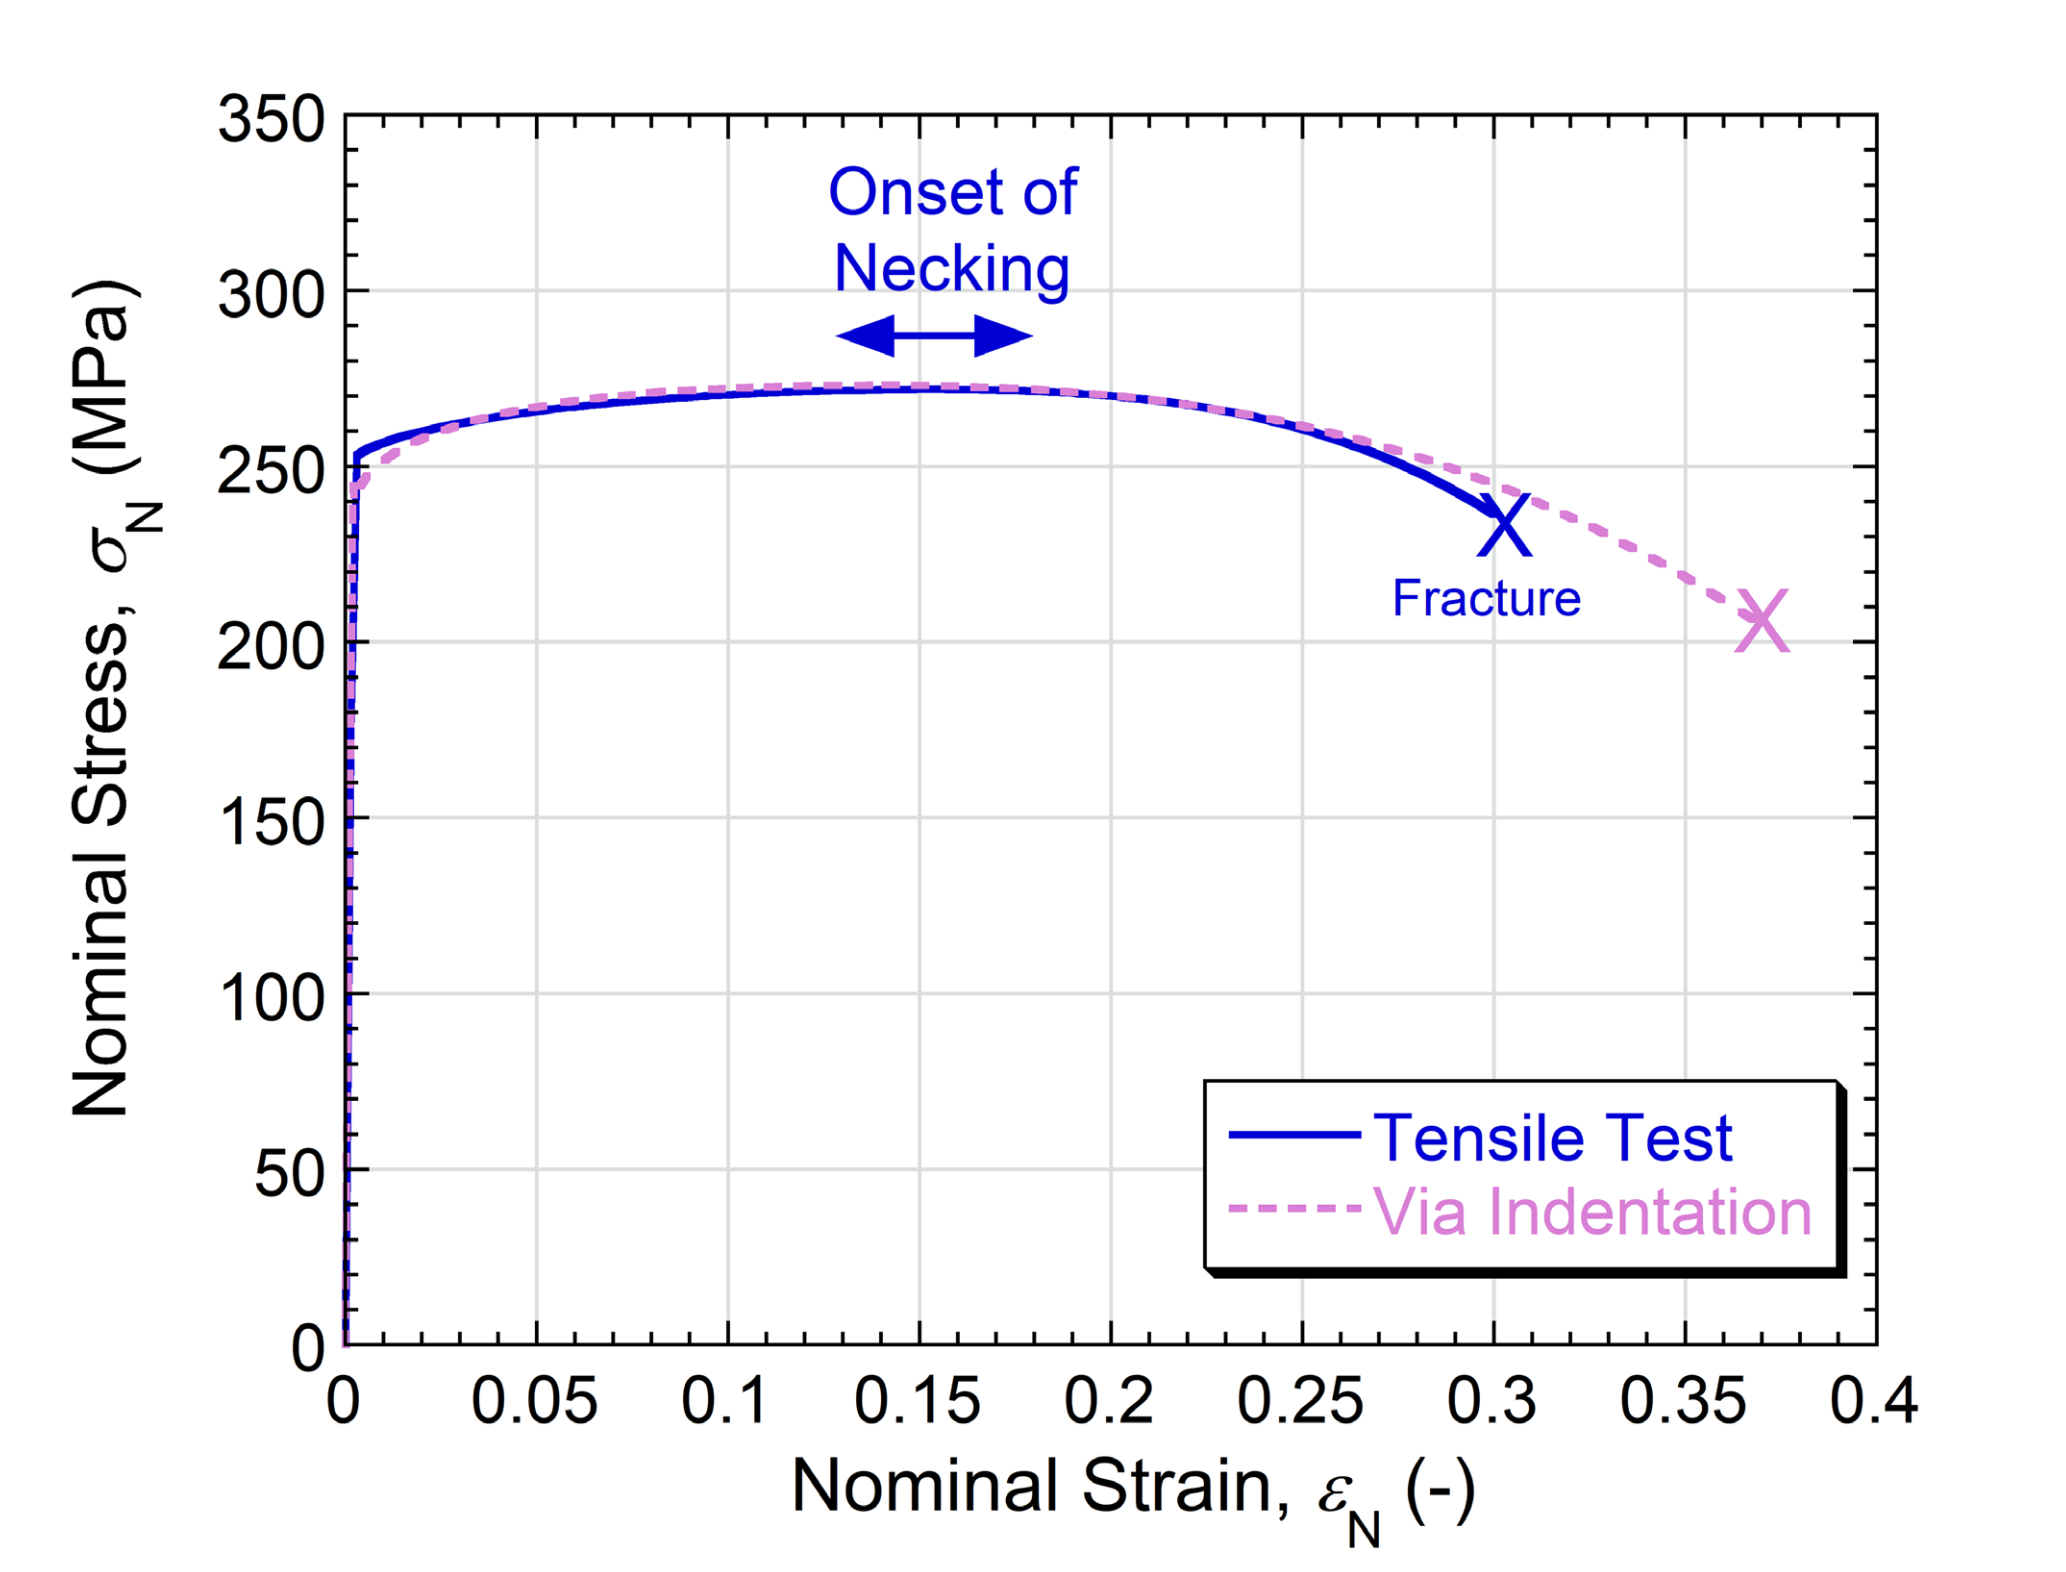
Indentation plastometry has been designed with scale effects very much in mind. The need to ensure that a representative(multi-grain) region is being tested was identified during its development [24,25]. Indenter diameters are typically 1 or 2 mm and indent depths ~ few hundredµm. Unless the grain size is unusually coarse, this ensures that the deformed volume contains many grains. Fig.9 conveys an impression of a typical scenario.Moreover, since the general nature of stress and strain fields remains broadly similar during penetration (and is accurately captured in the associated FEM modelling, with full account taken of constraint effects), outcomes cannot be affected by instabilities such as necking (tensile testing) or barrelling / buckling(compressive testing). It is, in fact, not only easier and quicker than those tests, but also more reliable! A stress-strain curve, obtained via indentation plastometry, on a work-hardened copper is shown in Fig.9. Included in the plot is a stress-strain curve obtained from a uniaxial tensile test on the same material. It's clear to see that the level of agreement is very good, even in the post-necking regime (although, as already described, there is little very meaningful that can be obtained in this regime).
Finally, when using Indentation Plastometry, interesting features can be seen on the free surface adjacent to indents, such as the persistent slip bands evident in individual grains in Fig.10.
Figure 10: Optical micrograph [24] of the free surface of a copper sample, adjacent to an indent (created by a sphere of radius 1 mm) of depth about 400 µm. The average grain size of the sample is around 100 µm.
References
1. Roters, F, P Eisenlohr, L Hantcherli, DDTjahjanto, TR Bieler, and D Raabe, Overview of Constitutive Laws, Kinematics, Homogenization and Multiscale Methods in Crystal Plasticity Finite-Element Modeling: Theory, Experiments, Applications. Acta Materialia, 2010. 58(4): p.1152-1211.
2. Matic, P, GC Kirby, and MI Jolles, The Relation of Tensile Specimen Size and Geometry Effects to Unique ConstitutiveParameters for Ductile Materials. Proceedings of the Royal Society of LondonSeries a-Mathematical and Physical Sciences, 1988. 417(1853): p. 309-333.
3. Yang, L and L Lu, The Influence of Sample Thickness on the Tensile Properties of Pure Cu with Different Grain Sizes. Scripta Materialia, 2013. 69(3): p. 242-245.
4. Wei, YG, XZ Wang, and MH Zhao, Size Effect Measurement and Characterization in Nanoindentation Test. Journal of MaterialsResearch, 2004. 19(1): p. 208-217.
5. Golovin, Y, Nanoindentation and Mechanical Properties of Solids in Submicrovolumes, Thin near-Surface Layers, and Films: AReview. Physics of the Solid State, 2008. 50(12): p. 2205-2236.
6. Voyiadjis, GZ and M Yaghoobi, Review of Nnoindentation Size Effect: Experiments and Atomistic Simulation. Crystals,2017. 7(10).
7. Nix, WD and H Gao, Indentation Size Effects in Crystalline Materials: A Law for Strain Gradient Plasticity. Journal of the Mechanics and Physics of Solids, 1998. 46: p. 411-425.
8. Elmustafa, AA and DS Stone, Nanoindentation and the Indentation Size Effect: Kinetics of Deformation and Strain Gradient Plasticity. Journal of the Mechanics and Physics of Solids, 2003. 51: p.357-381.
9. Zhao, MH, WS Slaughter, M Li, and SX Mao,Material-Length-Scale-Controlled Nanoindentation Size Effects Due to Strain-Gradient Plasticity. Acta Materialia, 2003. 51(15): p. 4461-4469.
10. Lee, H, S Ko, J Han, H Park, and W Hwang, Novel Analysis for Nanoindentation Size Effect Using Strain Gradient Plasticity. Scripta Materialia, 2005. 53(10): p. 1135-1139.
11. Lorenz, D, A Zeckzer, U Hilpert, P Grau, H Johansen, and HS Leipner, Pop-in Effect as Homogeneous Nucleation of Dislocations During Nanoindentation. Physical Review B, 2003. 67(17).
12. Shim, S, H Bei, EP George, and GM Pharr, ADifferent Type of Indentation Size Effect. Scripta Materialia, 2008. 59(10): p.1095-1098.
13. Barnoush, A, MT Welsch, and H Vehoff, Correlation between Dislocation Density and Pop-in Phenomena in Aluminum Studied by Nanoindentation and Electron Channeling Contrast Imaging. Scripta Materialia, 2010. 63(5): p. 465-468.
14. Morris, JR, H Bei, GM Pharr, and EPGeorge, Size Effects and Stochastic Behavior of Nanoindentation Pop In. Physical Review Letters, 2011. 106(16).
15. Ahn, TH, CS Oh, K Lee, EP George, and HN Han, Relationship between Yield Point Phenomena and the Nanoindentation Pop-in Behavior of Steel. Journal of Materials Research, 2012. 27(1): p. 39-44.
16. Chrobak, D, K Nordlund, and R Nowak, Nondislocation Origin of Gaas Nanoindentation Pop-in Event. Physical ReviewLetters, 2007. 98(4).
17. Wang, ZG, H Bei, EP George, and GM Pharr, Influences of Surface Preparation on Nanoindentation Pop-in in Single-Crystal Mo. Scripta Materialia, 2011. 65(6): p. 469-472.
18. Uchic, MD and DA Dimiduk, A Methodology to Investigate Size Scale Effects in Crystalline Plasticity Using Uniaxial Compression Testing. Materials Science and Engineering a-Structural Materials Properties Microstructure and Processing, 2005. 400: p. 268-278.
19. Uchic, MD, DM Dimiduk, JN Florando, and WDNix, Sample Dimensions Influence Strength and Crystal Plasticity. Science, 2004. 305(5686): p. 986-989.
20. Soler, R, JM Wheeler, HJ Chang, JSegurado, J Michler, J Llorca, and JM Molina-Aldareguia, Understanding Size Effects on the Strength of Single Crystals through High-Temperature Micropillar Compression. Acta Materialia, 2014. 81: p. 50-57.
21. Shahbeyk, S, GZ Voyiadjis, V Habibi, SHAstaneh, and M Yaghoobi, Review of Size Effects During Micropillar Compression Test: Experiments and Atomistic Simulations. Crystals, 2019. 9(11).
22. Bittencourt, E, Interpretation of the Size Effects in Micropillar Compression by a Strain Gradient Crystal PlasticityTheory. International Journal of Plasticity, 2019. 116: p. 280-296.
23. Takata, N, S Takeyasu, HM Li, A Suzuki,and M Kobashi, Anomalous Size-Dependent Strength in Micropillar Compression Deformation of Commercial-Purity Aluminum Single-Crystals. Materials Science and Engineering a-Structural Materials Properties Microstructure andProcessing, 2020. 772.
24. Campbell, JE, RP Thompson, J Dean, and TW Clyne, Comparison between Stress-Strain Plots Obtained from Indentation Plastometry, Based on Residual Indent Profiles, and from Uniaxial Testing. Acta Materialia, 2019. 168: p. 87-99.
25. Campbell, JE, RP Thompson, J Dean, and TWClyne, Experimental and Computational Issues for Automated Extraction of Plasticity Parameters from Spherical Indentation. Mechanics of Materials, 2018.124: p. 118-131
Frequently Asked Questions
How do metals deform plastically?
Plastic deformation requires a new configuration of the atoms, achieved primarily by slipping of atomic planes over each other. This happens through line defects called dislocations moving across the plane, much like moving a carpet by propagating a small ruck in it rather than dragging the whole thing. Dislocations move under a shear stress acting on the plane, and after extensive motion they interfere with each other, limiting mobility and producing work hardening.
Why does sample size matter in plasticity testing?
Plasticity characteristics depend in a complex and sensitive way on microstructure, so the outcome can only be captured if the region being deformed is large enough to be representative of the bulk. That usually means a relatively large number of grains must be present. There are also size effects relating to the constraint imposed on how the region can deform, which lead to incorrect results when the tested region is small.
What is a representative volume?
It is a tested volume large enough to capture the sensitivities to all of the microstructural features, which cover a large range of scales. Microstructure here includes the crystal structure of the phases present, grain size and shape, texture, alloy composition, grain boundary structure, initial dislocation density and impurity levels. If the section of a small sample contains only single grains or a handful of grains, its response is likely to differ significantly from that of the bulk.
How does a polycrystal differ from a single crystal under load?
In a polycrystal, the deformation of each grain has to be compatible with that of its neighbours from the start, creating a strong constraint effect. Slip is therefore required on more than one plane in virtually all grains, and substantially higher stresses are needed for yielding and plasticity than for a single crystal. The stress-strain curve also shows none of the stages seen initially with a single crystal.
Do sample dimensions affect a conventional tensile test?
Yes, particularly in the post-necking regime. After the peak in the nominal stress-strain curve, virtually all recorded elongation is due to straining in the neck, so shorter samples show a larger apparent strain because the neck constitutes a greater proportion of the gauge length. For a given gauge length, a larger diameter also increases the contribution from necking.
Is elongation at failure a meaningful measure of ductility?
The nominal strain at fracture does not correspond to the true strain in the neck, which is usually much higher, so ductility values are virtually meaningless in an absolute sense. Elongation at failure and reduction of area depend on sample dimensions in ways that cannot be interpreted to obtain meaningful information. Yield stress, work hardening up to necking and the UTS remain valid outcomes.
Is Reduction of Area a better measure than elongation at failure?
It is sometimes presented that way, partly because elongation depends on the aspect ratio of the gauge length, and there is something in that argument. RA is still some way from being a genuinely meaningful parameter. It is hard to measure accurately on samples that are not circular in section, it is affected by both the uniform deformation before necking and the neck itself, and it is sensitive to the late stages of necking.
Are nanoindentation results reliable for plasticity characteristics?
The volumes deformed have dimensions in the µm or nm range and usually comprise single crystals, so they cannot be representative of corresponding bulk material. Measured hardness tends to rise as the scale of indentation is reduced, a size effect illustrated by data showing a rise from around 0.5 GPa to around 2 GPa for gold as indent depth falls from about 100 nm to about 5 nm. Properties obtained this way do not reflect an inherent, scale-independent characteristic of the material.
What causes the indentation size effect?
Various explanations have been proposed, most based on dislocation-related phenomena, including strain gradients requiring geometrically-necessary dislocations, and a need for higher stress to nucleate dislocations in a volume that initially contains none. Pop-in features in load-displacement plots support the nucleation argument, though they may also arise from martensitic transformations or rupture of a surface oxide film. The explanation remains unclear, and correcting for the size effect in a well-defined way is not really viable at present.
What is micro-pillar compression and what are its limits?
It uses similar equipment to nanoindentation, with a maximum load around 1 N, which caps sample diameter at roughly 50 µm for materials yielding at up to 500 MPa. Apparent yield stresses are usually very different from conventional compressive tests on the same single crystal, tending to be higher for smaller samples and well above conventional values. Outcomes can be interesting and the images attractive, though extraneous effects that are difficult to quantify prevent reliable information about the real plasticity characteristics being obtained.
Are there size effects in indentation plastometry?
The technique was designed with scale effects in mind, using indenter diameters of typically 1 or 2 mm and indent depths of a few hundred µm, which ensures the deformed volume contains many grains unless the grain size is unusually coarse. Because the nature of the stress and strain fields stays broadly similar during penetration and is captured in the associated FEM modelling with full account taken of constraint effects, outcomes cannot be affected by necking, barrelling or buckling. A stress-strain curve obtained this way on work-hardened copper agrees very closely with uniaxial tensile testing on the same material.

Bill was Chief Scientific Officer atPlastometrex (now retired) and Emeritus Fellow in the Mechanics of Materials atthe University of Cambridge, where he served as Professor of the Mechanics ofMaterials. A Fellow of the Royal Academy of Engineering, his research spans thethermo-mechanical behaviour of composites and surface coatings, with a focus onprocess simulation and numerical modelling of material performance. His work onindentation techniques and residual stress measurement underpins much of thePIP methodology now commercialised by Plastometrex.