Necking occurs during most tensile tests on metals, arising when work hardening can no longer counter the tendency towards strain localisation. This guide explains the difference between nominal and true stress-strain plots, why the Considère criterion predicts the onset of necking at the peak of the nominal curve, and why UTS and elongation at failure carry little information about what actually happens in the neck. It also shows how FEM modelling, combined with a critical strain criterion, predicts necking and final rupture, and where indentation plastometry offers an advantage in reaching higher plastic strains.
Necking occurs during most tensile tests on metals. It's an instability that arises when the strain hardening effect is no longer sufficient to counter the tendency towards strain localisation. Such instabilities were analysed by Considère well over a century ago. The factors affecting its onset are thus well established, but interpretation of stress-strain curves in the post-necking regime is complex and often misunderstood. However, FEM modelling allows various insights into this regime, with potential for revealing important information (about the final fracture event, as well as post-necking plasticity).
Nominal and true stress-strain plots
Understanding of necking requires distinguishing between nominal and true stresses and strains. The standard outcome of a tensile test is a stress-strain curve. Such plots commonly extend up to relatively high (plastic) strains - at least a few % and commonly several tens of %. The stress is routinely equated to the applied force divided by the original sectional area and the strain to the change in length (along the loading direction) divided by the original length. In fact, these are “nominal”(or “engineering”) values. The true stress acting on the material at any stage is the force divided by the current sectional area. After a finite (plastic)strain, this area is less than the original area, as a result of the lateral contraction needed to conserve volume, so that the true stress is greater than the nominal stress.
Consider a sample of initial length L0, with an initial sectional area A0. For an applied force F and a current sectional area A, conserving volume, the true stress can be written
σT = F/A = FL / (A0 L0) = (F/A0)(1 + εN) = σN(1 + εN)
where σN is the nominal stress and εN is the nominal strain. The value of εN is positive, so σT is larger than σN. Similarly, the true strain can be written
εT = ∫ (from L0 to L) dL/L = ln(L/L0) = ln(1 +εN)
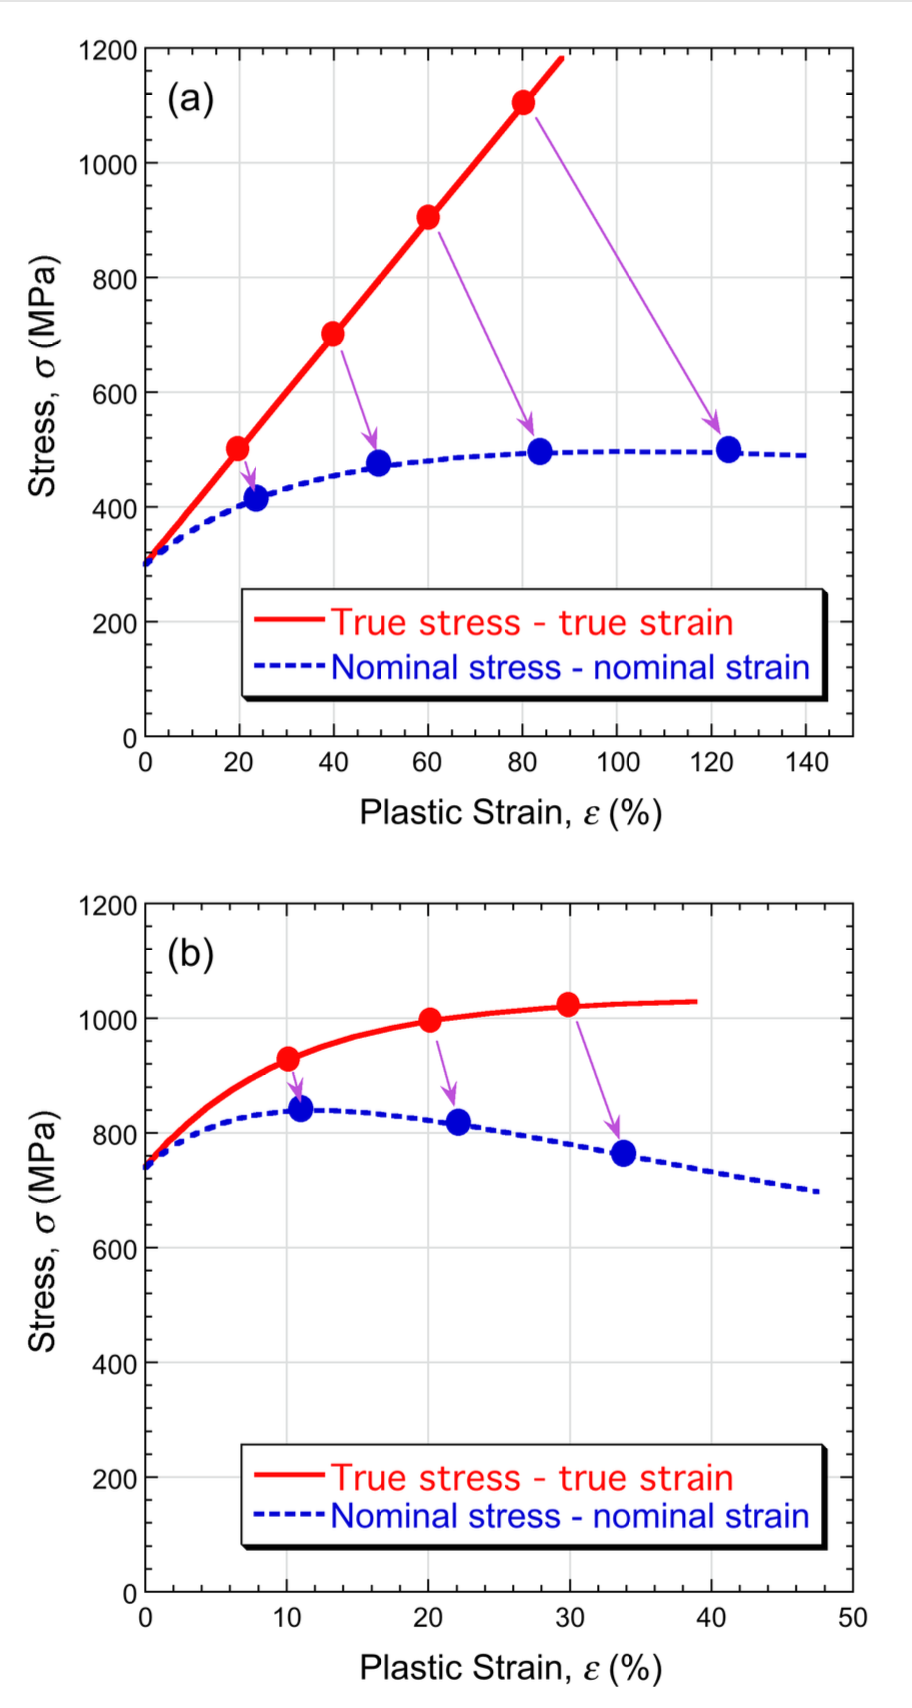
The value of εT is thus smaller than εN. For strains exceeding a few %, differences between true and nominal values become significant. This is illustrated by Fig.1, which shows true stress v. true(plastic) strain plots and corresponding nominal stress v. nominal strain curves (obtained from the true curve via Eqns. (1) and (2)). This is done for two different types of (true) stress-strain relationship, the first exhibiting linear “work hardening” (constant gradient) and the second showing a progressive reduction in this gradient (the work hardening rate). In practice, this is more common than linear work hardening. True stress-strain curves are often represented by “constitutive laws” (analytical equations). This second plot conforms to the Voce law:
σ = σS – (σS – σY) exp(–ε / ε0)
where σS is a saturation stress, σY is the yield stress and ε0 is a characteristic strain. The values of these parameters for the case shown are indicated in the caption.
The conversions are thus straightforward, but they are only valid if the stress and strain fields within the sample (gauge length) are uniform (homogeneous) - which is not the case after the onset of necking. In practice, it is common to consider only the nominal plot, and several procedures for extraction of key parameters are based only on inspection of such curves. However, if the objective is to obtain fundamental information about the plasticity (and failure) characteristics of the material, then it is a plot of true stress against true strain that provides this.
The cause of necking
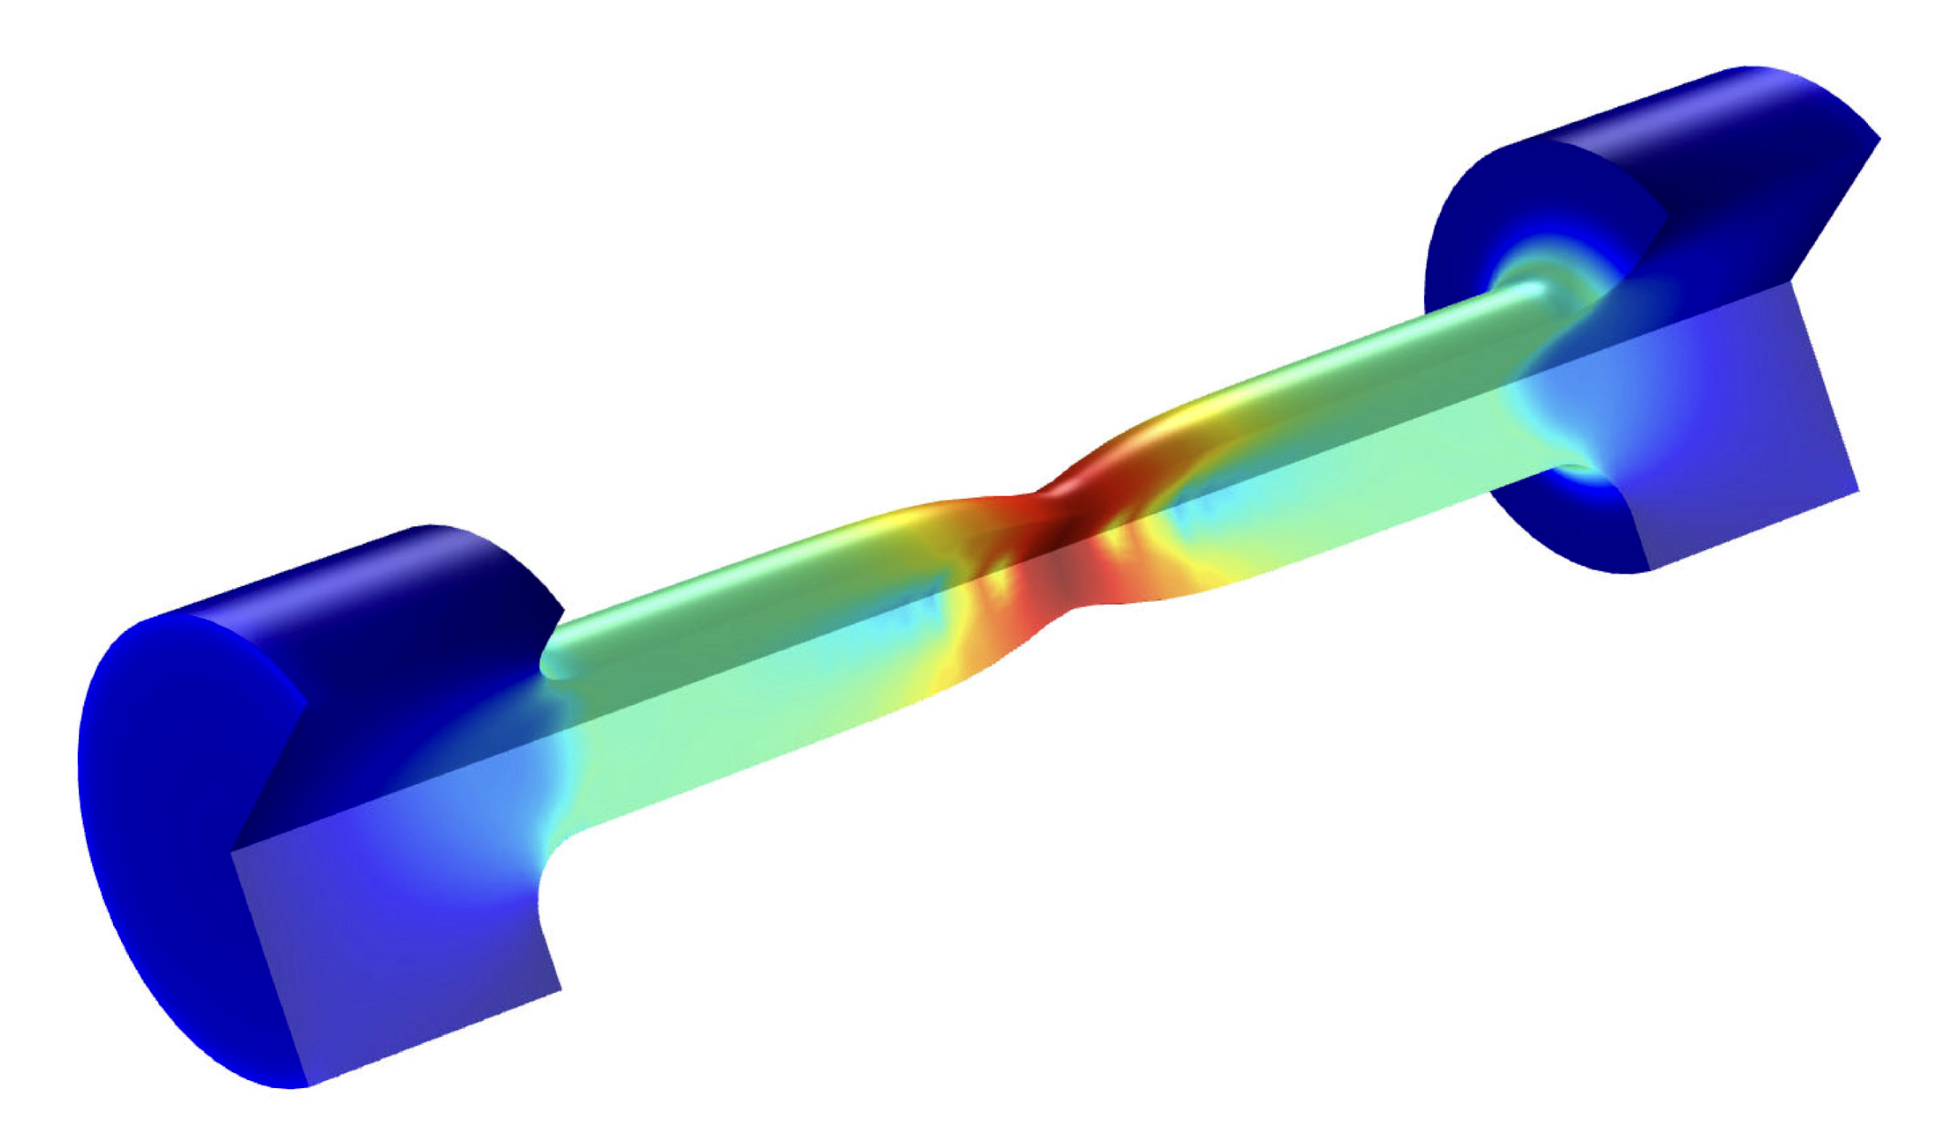
With a brittle material, tensile testing may give an approximately linear stress-strain plot, followed by fracture (at a stress that may be affected by the presence and size of flaws). However, most metals do not behave in this way and are likely to experience considerable plastic deformation before they fail. Initially, this is likely to be uniform throughout the gauge length. Eventually, of course, the sample will fail(fracture). However, in most cases, failure will be preceded by at least some necking. The formation of a neck is closely tied in with work hardening (strain hardening). Once a neck starts to form, the (true) stress there will be higher than elsewhere, probably leading to more straining there, further reducing the local sectional area and accelerating the effect.
In the complete absence of work hardening, the sample will be very susceptible to this effect and will be prone to necking from an early stage. Work hardening, however, acts to suppress necking, since any local region experiencing higher strain will move up the stress-strain curve and require a higher local stress in order for straining to continue there. Generally, this is sufficient to ensure uniform straining and suppress early necking. However, this balance is likely to shift and eventually render the sample vulnerable to necking. Furthermore, some materials (with low work hardening rates) may be susceptible to necking from the start.
Analysis of Necking
Prediction of the onset of necking, for a metal with a given (true) stress-strain curve, can be made on a simple analytical basis. The phenomenon was originally analysed by Armand Considère(1885), in the context of the stability of structures such as bridges. While it is based on consideration of true stress levels, it leads to the simple outcome that necking is predicted to start at the point where the nominal stress v.nominal strain plot reaches a peak. For example, the material represented inFig.1(a) is predicted to start necking at a nominal strain of about 100%, while that in Fig.1(b) would start at about 10%. After this point, actual nominal stress-strain curves will differ from those in Fig.1. While the Considère criterion is broadly reliable, it provides no information about what happens after the neck starts to develop or when it might fracture.
It is common during tensile testing to extract the “strength”, in the form of an “Ultimate Tensile Stress” (UTS). This is usually taken to be the peak on the nominal stress v. nominal strain plot, which corresponds to the onset of necking, as outlined above. For the material of Fig.1(a), the UTS is about 500 MPa, while for that of Fig.1(b) it's about850 MPa. This value is clearly not the true stress acting at failure. This is difficult to obtain in a simple way, since, once necking has started, the (changing)sectional area is unknown. Furthermore, the “ductility” (or “failure strain”,or “elongation at failure”), usually taken as the nominal strain at fracture -which is commonly well beyond the strain at the onset of necking - does not correspond to the true strain in the neck when fracture occurs. In fact, the values quoted for ductility have little or no real significance, despite their widespread usage. However, the real situation can be accurately captured viaFEM modelling – see below.
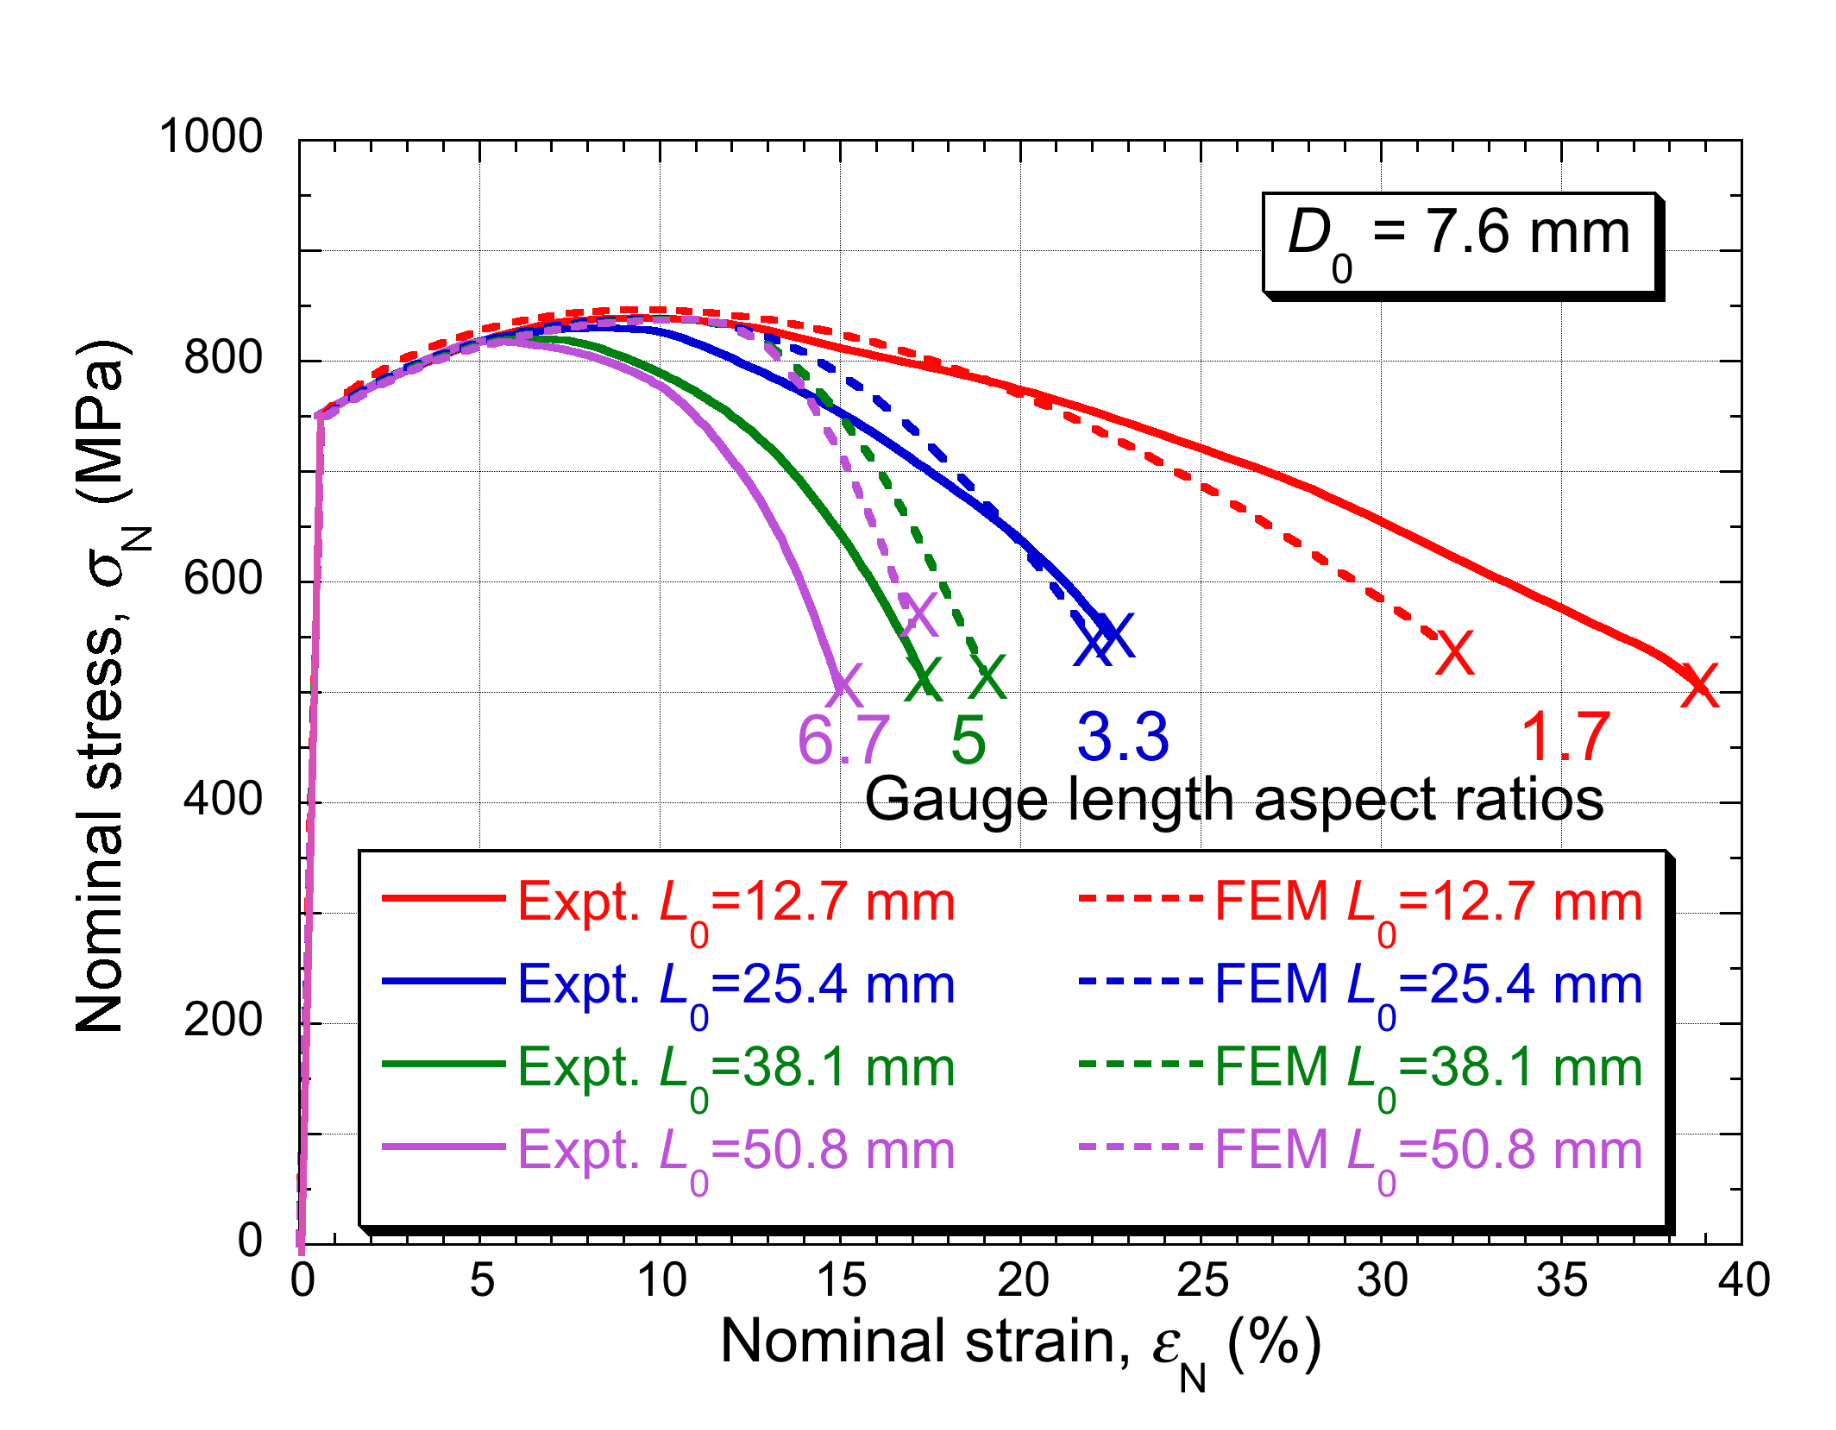
This point about the virtually meaningless nature of a ductility value is illustrated by the plots [1] shown in Fig.2, which relate to HY-100 steel samples tensile tested with a range of values for the gauge length. The true stress-strain relationship for this steel is well captured by the plot in Fig.1(b), which was used in these FEM simulations.While the behaviour was similar for all samples up to the point of necking (peak in the plot), which was at ~8-10% strain for this material, the elongation to failure values cover a huge range, being larger for the samples with lower aspect ratios. The cause of this is simple. After the peak, with necking taking place, virtually all of the recorded elongation is due to straining in the neck. For shorter samples, this region constitutes a greater proportion of the gauge length, making the increase in (nominal) “strain” larger. This effect can be well captured in an FEM model, as shown in Fig.2.
Final Fracture
Fig.2 includes indications of the points of fracture (marked with a cross). Prediction of this requires some kind of criterion. A common one, which was used in Fig.2, is the true strain (in the neck) reaching a critical level. This is based on the concept that, by this point, the ductility of the material will have become “exhausted” and a crack will propagate through it. These strains are often found to be relatively large- typically several tens of % and perhaps over 100%. Of course, the value is expected to vary between metals. This is not a rigorous fracture mechanics approach, but it is widely employed and obtaining an experimental estimate for the critical strain value is a useful operation. In this way, for a known true stress–strain relationship, FEM simulation can be used to predict the onset and development of necking, and the final rupture event. Conversely, by optimising the fit regarding the fracture point, an experimental (nominal) stress-strain curve can be used to obtain a critical fracture strain.
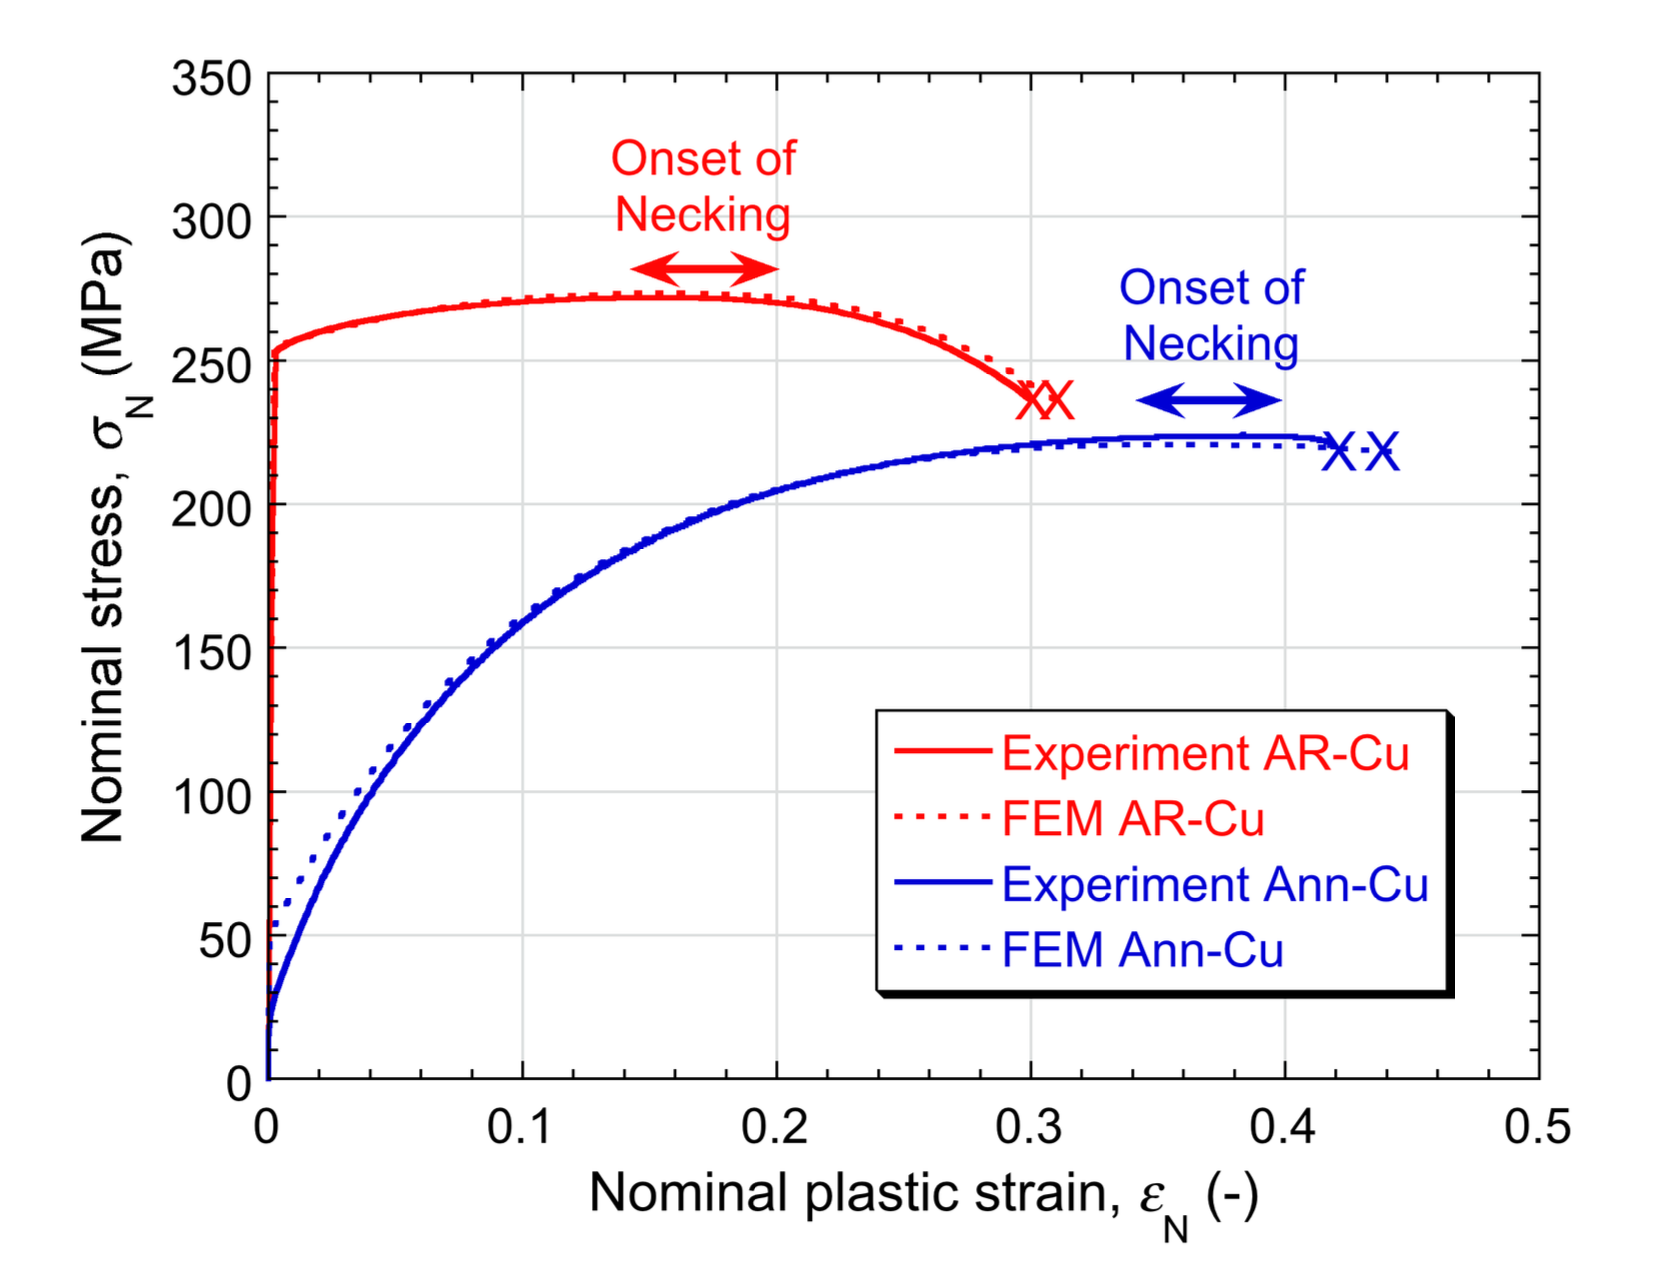
A comparison is shown in Fig.3 between measured and predicted (nominal) stress-strain curves for two Cu samples [2]. A critical true strain level was used to determine the fracture point, with the values shown in the caption. There is thus scope for using FEM (with an appropriate true stress-strain relationship) to predict the complete tensile stress-strain curve, including the necking and rupture, but a caveat should be added. Such predictions are based on assuming that the (true) stress-strain relationship holds up to the (high) strains that are likely to be generated in the neck. Since this relationship will have been inferred only on the basis of the response up to the onset of necking (perhaps a few tens of % at most), and the strains created in the neck may reach higher values, this may not be reliable. It may be noted here that the indentation plastometry technique offers potential advantages over tensile testing in this respect, since it's often possible to create significantly higher plastic strains (in a controlled way) during indentation, so that the inferred stress-strain relationship can be representative of the behaviour over a greater range of plastic strain than that created (in a well-defined way) during tensile testing.
References
1. Matic, P, GC Kirby and MI Jolles, The Relation of Tensile Specimen Size and Geometry Effects to Unique ConstitutiveParameters for Ductile Materials. Proceedings of the Royal Society of London Series a-Mathematical and Physical Sciences, 1988. 417(1853): p. 309-333.
2. Campbell, JE, RP Thompson, J Dean and TW Clyne, Comparison between stress-strain plots obtained from indentation plastometry, based on residual indent profiles, and from uniaxial testing. Acta Materialia, 2019. 168: p. 87-99.
Frequently Asked Questions
What is necking in a tensile test?
Necking is an instability that arises when the strain hardening effect is no longer sufficient to counter the tendency towards strain localisation. Once a neck starts to form, the true stress there is higher than elsewhere, which drives more straining at that location, further reducing the local sectional area and accelerating the effect. Most metals experience considerable plastic deformation before failing, and in most cases failure is preceded by at least some necking.
What is the difference between true and nominal stress-strain curves?
Nominal or engineering values divide the applied force by the original sectional area and the change in length by the original length. True stress is the force divided by the current sectional area, which is smaller after plastic strain because of the lateral contraction needed to conserve volume, so true stress is greater than nominal stress. True strain is correspondingly smaller than nominal strain, and for strains beyond a few per cent the differences become significant.
When can nominal values be converted to true values?
The conversions are straightforward, but only valid while the stress and strain fields within the gauge length remain uniform. That ceases to be the case after the onset of necking. Where the objective is fundamental information about plasticity and failure characteristics, a plot of true stress against true strain is what provides it.
What is the Considère criterion?
Armand Considère analysed these instabilities in 1885, in the context of the stability of structures such as bridges. Although based on consideration of true stress levels, the analysis leads to the simple outcome that necking is predicted to begin where the nominal stress against nominal strain plot reaches a peak. The criterion is broadly reliable, but gives no information about what happens once the neck starts to develop or when it might fracture.
Does work hardening prevent necking?
Work hardening acts to suppress it, because any local region experiencing higher strain moves up the stress-strain curve and requires a higher local stress for straining to continue there. That is generally enough to ensure uniform straining and delay early necking, though the balance eventually shifts and the sample becomes vulnerable. Materials with low work hardening rates may be susceptible to necking from the start, and a sample with no work hardening at all is very susceptible from an early stage.
What does the Ultimate Tensile Stress actually represent?
UTS is usually taken as the peak on the nominal stress against nominal strain plot, which corresponds to the onset of necking. It is clearly not the true stress acting at failure, which is difficult to obtain in a simple way because the sectional area is unknown once necking has started.
Why is elongation at failure considered unreliable?
The nominal strain at fracture is commonly well beyond the strain at the onset of necking, and it does not correspond to the true strain in the neck when fracture occurs. FEM plots for HY-100 steel samples show behaviour that is similar for all samples up to the point of necking, at around 8-10% strain, after which elongation to failure values cover a huge range depending on gauge length aspect ratio. After the peak, virtually all recorded elongation comes from straining in the neck, so shorter samples record a larger nominal strain because the neck occupies a greater proportion of the gauge length.
How is final fracture predicted?
A common criterion is the true strain in the neck reaching a critical level, on the concept that the ductility of the material has become exhausted by that point and a crack will propagate through it. These critical strains are often relatively large, typically several tens of per cent and sometimes over 100%, and the value varies between metals. The approach is not rigorous fracture mechanics, though it is widely employed, and obtaining an experimental estimate of the critical strain is a useful operation.
Can FEM modelling predict the whole tensile curve including rupture?
Yes, with an appropriate true stress-strain relationship, FEM can predict the complete curve including necking and rupture, and the fit to the fracture point can also be used in reverse to obtain a critical fracture strain. One caveat applies: such predictions assume the true stress-strain relationship holds up to the high strains generated in the neck. Since that relationship is usually inferred only from the response up to the onset of necking, perhaps a few tens of per cent at most, it may not be reliable at the strains the neck reaches.
How does indentation plastometry compare on this point?
It offers a potential advantage over tensile testing, because significantly higher plastic strains can often be created in a controlled way during indentation. The inferred stress-strain relationship can therefore be representative of behaviour over a greater range of plastic strain than tensile testing generates in a well-defined way.

Bill was Chief Scientific Officer atPlastometrex (now retired) and Emeritus Fellow in the Mechanics of Materials atthe University of Cambridge, where he served as Professor of the Mechanics ofMaterials. A Fellow of the Royal Academy of Engineering, his research spans thethermo-mechanical behaviour of composites and surface coatings, with a focus onprocess simulation and numerical modelling of material performance. His work onindentation techniques and residual stress measurement underpins much of thePIP methodology now commercialised by Plastometrex.